
Fig. 7.
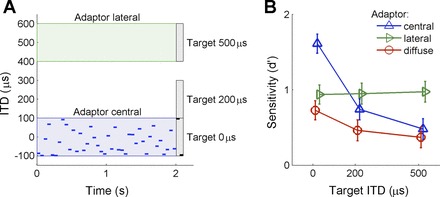
Psychophysical experiment. A: illustration of the behavioral task. A noise adaptor with ITDs randomly drawn each 50 ms was immediately followed by 2 target pure tones, also 50 ms in duration. The uniform distribution for the adaptors covered the ranges −100 to 100 μs for central adaptors, 400 to 600 μs for lateral adaptors, and −600 to 600 μs for diffuse adaptors (not shown). The target tones were centered at ITDs of 0 μs, 200 μs, or 500 μs. Target tones had the same ITDs for “same” trials and ITDs that differed by 200 μs for “different” trials. The example shown here is for a central adaptor, a 0 μs target, and “different” trial. B: discrimination performance (plotted as d′) for each adaptor employed as a function of target location. The mean d′ for the group of listeners (N = 10) is shown, together with the SE. Performance was best for central adaptor and 0 μs target (blue) compared with all other adaptor-target combinations. For lateral adaptors (green), performance remained level independent of the target presented. Discriminating intermediate targets benefited from lateral adaptor presentation. Finally, presentation of the diffuse adaptor (red) resulted in the lowest discrimination performance.