
Fig. 2.
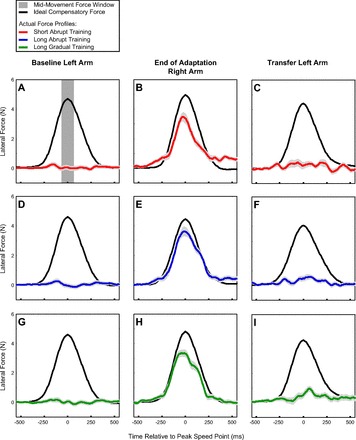
Lateral force profiles associated with training and interlimb transfer in experiment 1. Black trace in each panel shows the ideal compensatory force based on the movement velocity if the full strength force-field perturbation (|b| = 15 Ns/m) were applied. Colored traces show the actual force profiles averaged across subjects measured for the 3 training schedules: abrupt short (red), abrupt long (blue), and gradual long (green). Light gray shaded region represents the SE around the average lateral force profile. A, D, and G: lateral force profiles for the left hand prior to adaptation for the 3 training schedules. Dark gray stripe in A depicts the time window (70 ms before to 70 ms after the peak speed point of the movement) over which the midmovement force was measured. B, E, and H: lateral force profiles for the right hand at the end of adaptation (last 30% of the adaptation period). C, F, and I: lateral force profiles produced by the left hand on the first trial after adaptation of the right hand.