
Fig. 3.
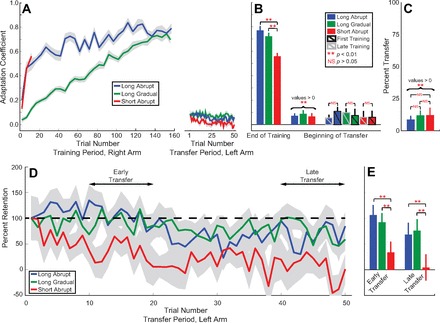
Time course of adaptation and interlimb transfer of adaptation when measured with error-clamp trials. A: the adaptation coefficient for the training of the right hand and transfer to the left hand is plotted against trial number for the 3 training schedules. Light gray background represents SE. Traces on right are the initial adaptation transfer (trial 1 of the transfer period) and the decay of transferred adaptation for the untrained left arm for the 3 training schedules. B, left: comparison of the average amount of adaptation achieved by the right hand at the end of the adaptation period (final 30% of trials) for each training schedule. Center: average amount of adaptation transferred to the left hand on the first trial of transfer after adaptation. Right: summary of the control analysis comparing the amount of adaptation transferred to the left hand when the respective training schedule was in the first session of the experiment (bars with black outline) as opposed to occurring in the second or third training session of the experiment (bars with gray outline). Error bars show SE. **Significant difference, NSno significant difference (α = 0.05). C: % of adaptation transferred to the left hand on the first trial of adaptation transfer: scaled ratio of the adaptation transferred to the amount of adaptation achieved at the end of training. D: decay of the transferred adaptation as % of the initial transferred adaptation. Data were scaled based on the first trial of transfer (i.e., the first trial represented 100% and % on subsequent trials was relative to this initial transfer trial). E: % of initial transferred adaptation early (trials 10–20) and late (trials 40–50) in the transfer period. **Significant differences (2-tailed t-test, P < 0.001).