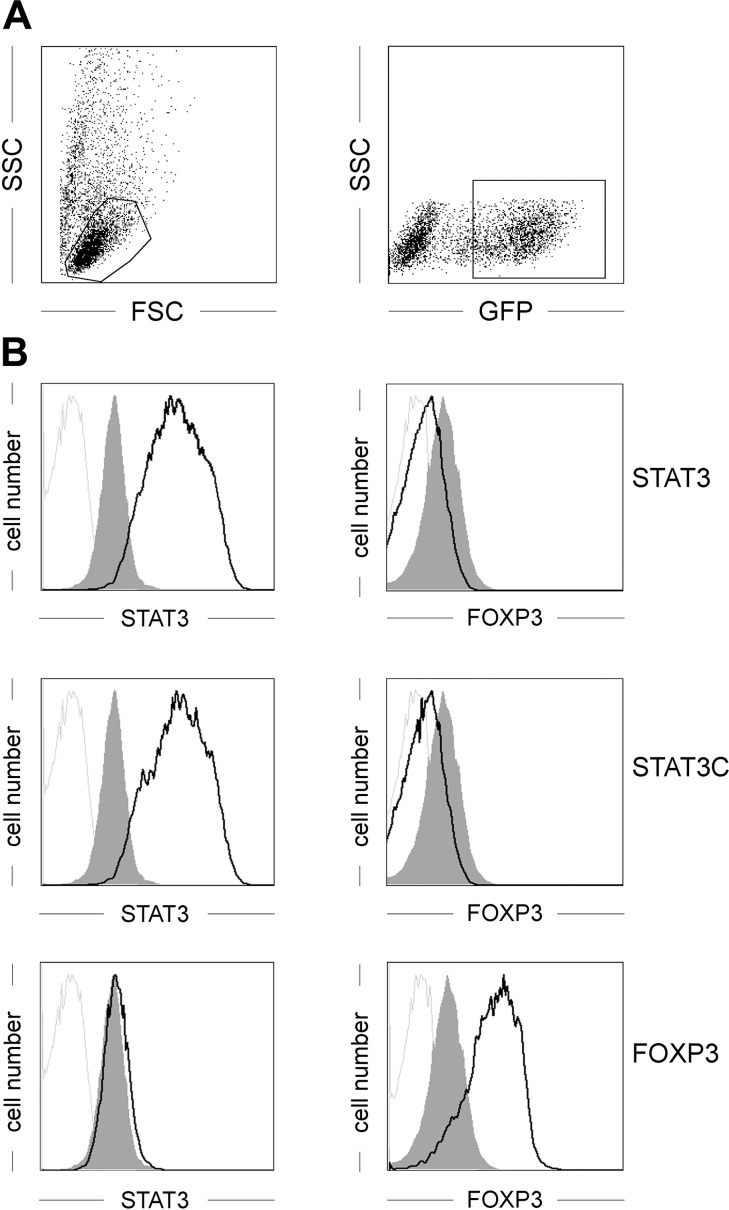
Figure 1.
Intracellular expression pattern in CD4+ T cells of transcription factors. Primary human CD4+ T cells were retrovirally transduced either with human STAT3, STAT3C, FOXP3, or an empty control vector and analyzed for expression of the indicated transcription factors. A) Gating strategy for positively transduced T cells. B) Intracellular expression levels of the indicated transcription factors in control vector-transduced cells (gray histograms) or transcription factor-transduced cells (black lines) using directly labeled mAbs. Gray lines depict staining with isotype-matched control mAb. One representative experiment of 8 is depicted.

