Figure 7.
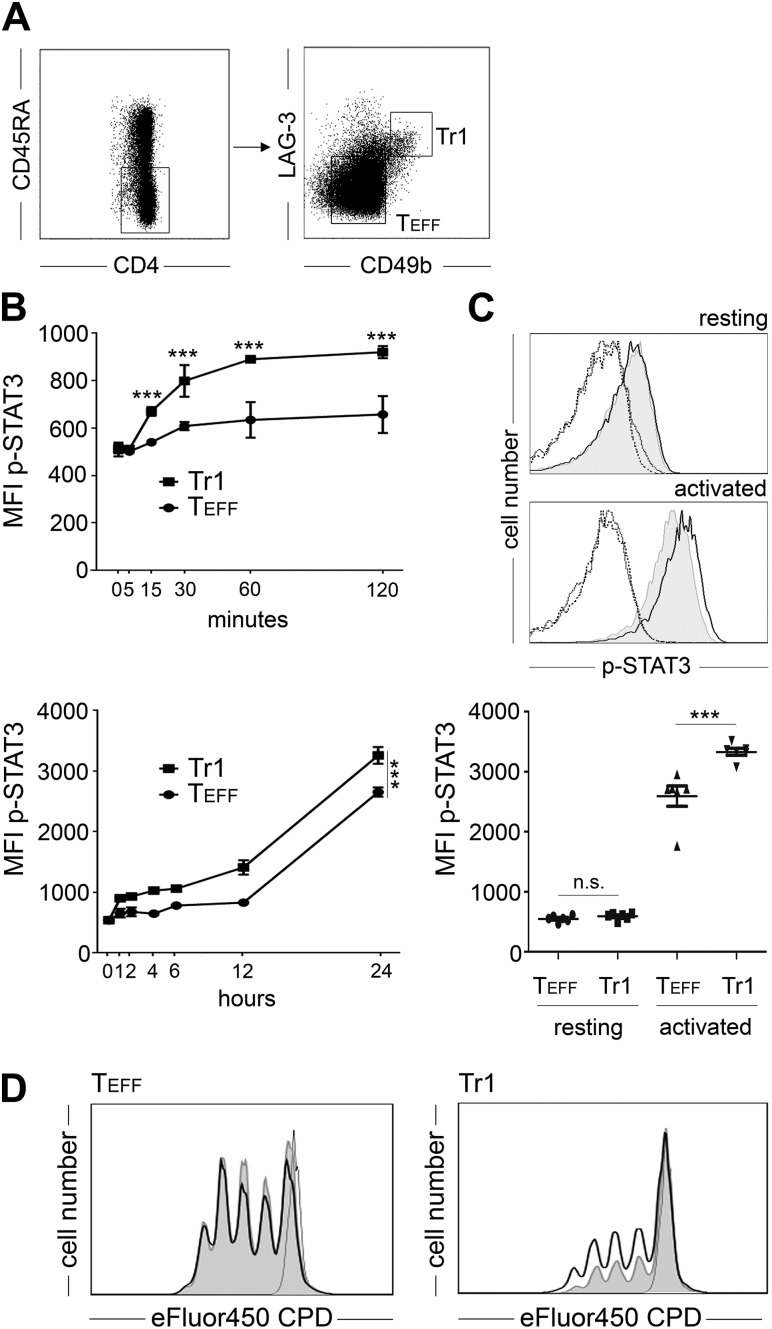
Activation-induced hyperphosphorylation and functional potential of STAT3 in Tr1 cells. A) Magnetic-activated cell-sorted CD4+ T cells were stained for surface expression of CD4, CD45RA, and the Tr1 markers CD49b, and LAG-3 and CD4+CD45RA− cells were further FACS sorted into TEFF and Tr1 cells according to the indicated gates. B) FACS-sorted Tr1 cells (black squares) or TEFF (black circles) was analyzed for STAT3 phosphorylation, indicated as mean fluorescence intensity (MFI p-STAT3, mean ± sd, n = 3) after anti-CD3/anti-CD28 mediated stimulation at the indicated early (upper graph) and late (lower graph) time points. C) FACS-sorted Tr1 cells (bold black line) or TEFF (gray histogram) was analyzed for phosphorylation of STAT3 directly after sorting (resting, upper panel) or 24 h after anti-CD3/anti-CD28 mediated stimulation (activated, lower panel). Isotype matched antibodies (dotted line for Tr1, dashed line for TEFF) served as controls. Data from 1 representative donor are depicted. Cumulative data for STAT3 phosphorylation from 6 individual donors are depicted in the lower diagram. D) eFluor450 CPD-labeled CD4+ T cells were sorted according to A and then stimulated with anti-CD3/anti-CD28 coated microbeads for 96 h in the absence (gray histogram) or presence (bold black line) of 100 µM STATTIC. Unstimulated cells (fine black line) served as controls. Left, LAG3-CD49b− TEFF; right, LAG3+CD49b+ Tr1 cells. Data from 1 representative experiment are depicted (n = 4). n.s., not significant; ***P < 0.001.

