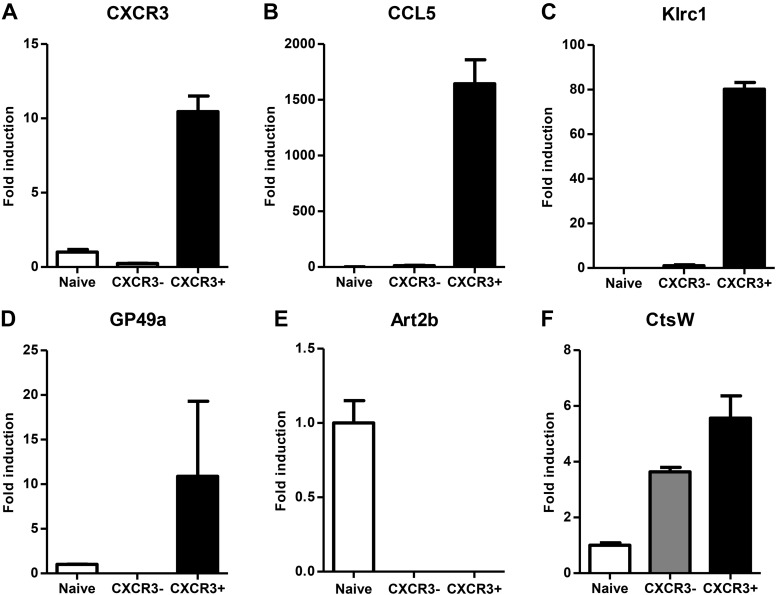
Figure 4.
qRT-PCR validation of select dysregulated genes among innate CD8+ T-cell subsets. A–F) Relative gene expression of (A) Cxcr3, (B) Ccl5, (C) Klrc1, (D) GP49b, (E) Art2b, and (F) CtsW in sorted CXCR3+ and CXCR3− innate CD8+ T-cell populations from naive CIBER mice as determined by qRT-PCR. Data are presented as fold induction relative to naive CD8+ T cells and as mean ± sem of duplicates obtained by pooling samples from 3 or 4 individual mice.

