
Figure 3.
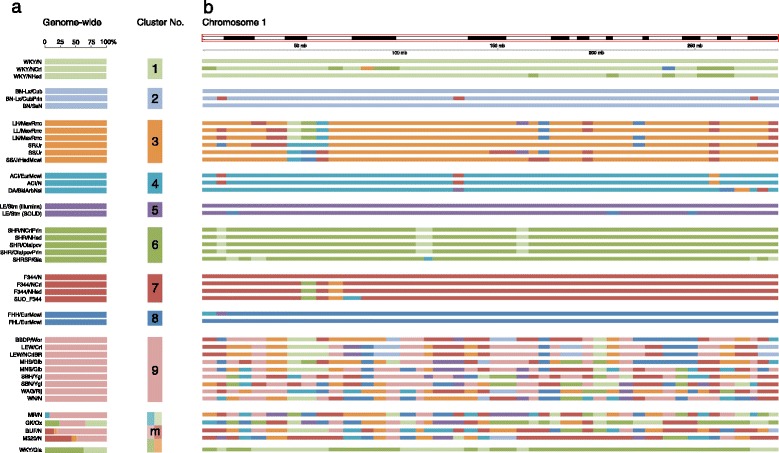
‘Population’ structure of 40 + 1 rat strains. (a) Per strain, the contribution from the 9 different clusters is plotted as percentage of the genome. Each cluster is represented by a separate color. The cluster designated with a ‘m’ represents the strains that have membership from multiple clusters. (b) Per strain, the genomic distribution along rat chromosome 1 is plotted as an example. The colors match the cluster colors from (a).