
Figure 5.
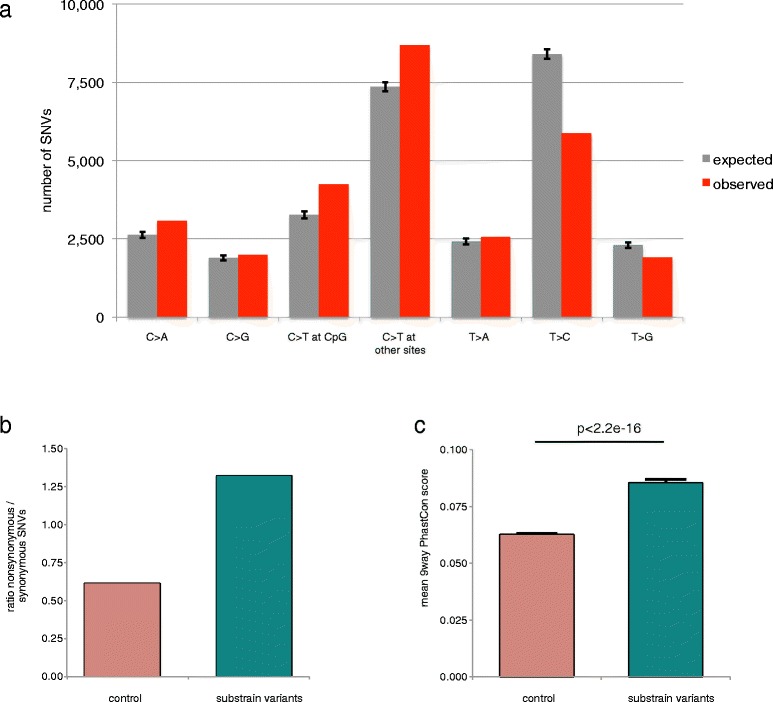
Substrain variant characteristics. (a) Bar plots showing the contribution of each nucleotide change for all substrain variants (observed) versus the control variants (expected). Error bars represent the 95% confidence interval. (b) Bar plot showing the Ka/Ks ratio ratio of the substrain variants versus the control variants. (c) Bar plot showing the average phastCons score for each substrain variant compared to the control variants. Substrain variants affect nucleotides with a significantly higher phastCons score (Student’s t-test; p < 2.2e-16). Error bars represent the SEM.