Figure 5.

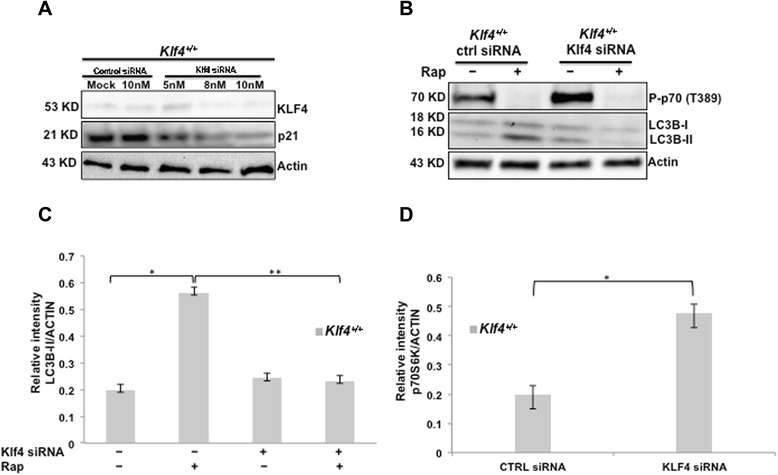
Klf4 knockdown leads to decreased autophagy levels and elevated mTOR activity. (A) Klf4 expression was inhibited by treating Klf4 +/+ MEFs with indicated concentrations of siRNA. Proteins were extracted from the cells 24 hrs after siRNA treatment. The levels of KLF4 and p21, a downstream target of KLF4, were assessed using Western blot. (B) Klf4 +/+ MEFs were treated with control siRNA or Klf4 siRNA complex. Five hours post transfection, transfection media was replaced with full-media that contained 100 nM rapamycin or DMSO as a control. Proteins were extracted 24 hrs after rapamycin treatment and Western blot analysis was performed to assay phospho-p70S6K and LC3 levels. (C) Densitometry analysis of LC3B bands shown in (B). The intensities of LC3BII bands were normalized to that of β-actin using Gel Imager program (Bio-Rad Laboratories, Hercules, CA). Error bars represent standard error. The experiments were repeated 3 times. * indicates p < 0.05, ** indicates p < 0.01. (D) Densitometry analysis of phospho-p70S6K bands shown in (B). The intensities of phospho-p70S6K bands were normalized to that of β-Actin using Gel Imager program. Error bars represent standard error. The experiments were repeated 3 times. * indicates p < 0.05.
