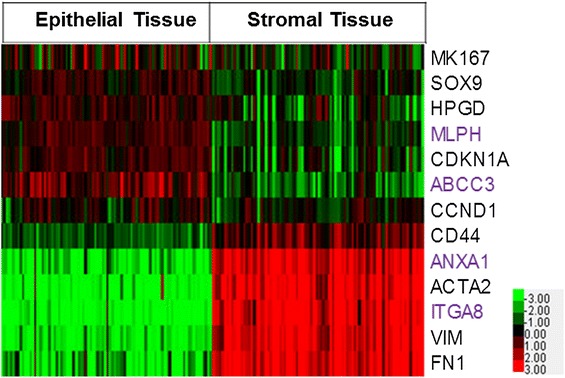
Figure 2.

Gene expression of known stromal and epithelial genes. Java Treeview heatmap of normalized relative gene expression (log 2 intensities) for genes whose expression is known to be restricted to epithelium or stroma from previous immunohistochemistry studies (black text). Genes analyzed by qRT-PCR in Figure 3 are also shown (purple text). Red indicates over-expressed genes and green indicates under-expressed genes; and the expression level is proportional to the brightness of the color (see color bar). Black indicates no difference in expression level between the two tissue types and lighter coloring indicates lower overall expression.
