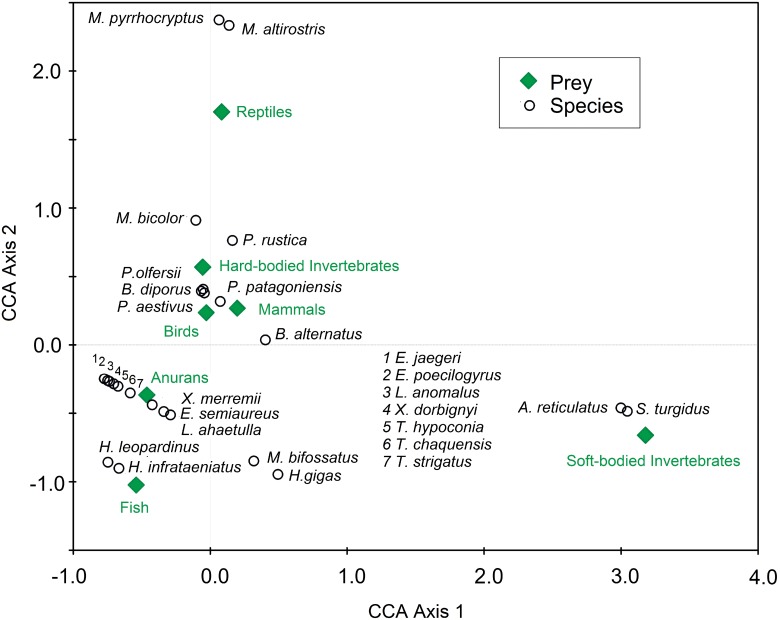
Fig 4. Biplot of snake diet from a phylogenetic ordination using canonical correspondence analysis (CCA).
Canonical axes represent linear combinations of diets to snake phylogeny. Snake diet items are weighted averages of each species’ score. The first canonical axis accounts for 40% and the second canonical axis accounts for 23% of the total variation. Diet items (rhombus) close to the graph centre (0,0) indicate either low association with any snake clade (circles) or a positive association with a specific combination of all snake clades. Diet items displayed in the periphery of the graph indicate either high association with a specific snake clade or an occasional association, particularly for that clade with low occurrence (Ter Braak and Smilauer, 2002).

