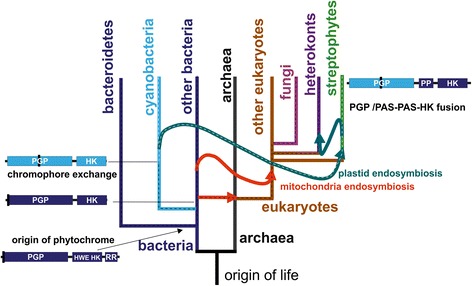
Figure 4.

Cartoon representation of the evolution of major groups that contain phytochromes and the pathways of the origin of streptophyte phytochromes. The tree is based on the assumption that eukaryotes evolved from archaea combined with a massive gene transfer from bacteria, as indicated by the straight arrow, to explain the chimeric character of eukaryotes [80]. Endosymbiosis is indicated with curved arrows. The dashed black lines indicate the evolutionary paths of bacterial phytochromes, the dashed white line shows the path of cyanobacterial and plant PGPs. Phytochrome drawings on the left and right side indicate the overall domain arrangement (PP, PAS-PAS domain of streptophyte phytochromes), chromophore-binding position (black line) and bacterial or cyanobacterial origin (blue or light blue line, respectively).
