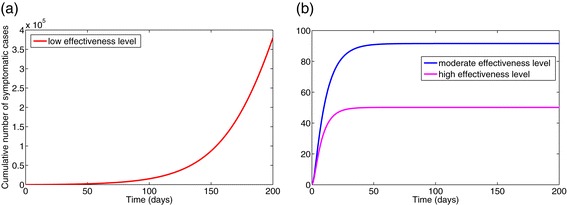
Figure 9.

Simulations of model (4). The cumulative number of symptomatic cases generated under various effectiveness levels of the basic public health control strategy is shown. (a) Low-effectiveness level. (b) Moderate- and high-effectiveness levels. Other parameter values used are as given in Table 3.
