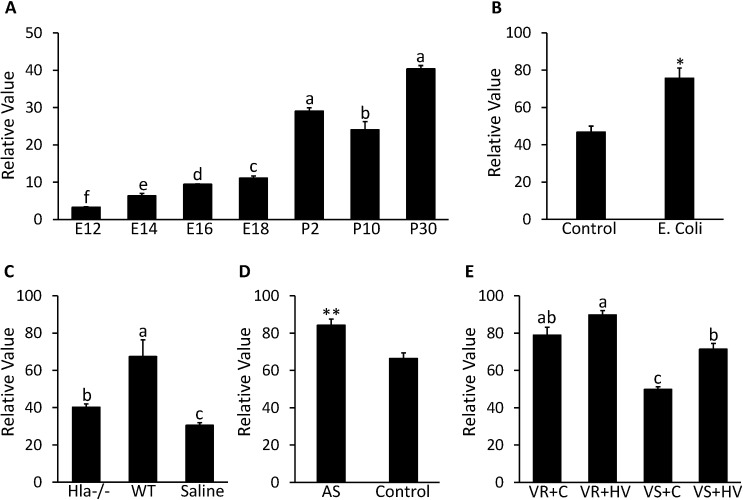
Fig 5. Expression profile in lung for CTLA2A in microarray DataSets obtained from NCBI website.
A, Expression in mice on embryonic day 12 (E12), 14 (E14), 16 (E16) and 18 (E18) and postnatal d 2 (P2), 10 (P10) and 30 (P30) in GDS3950 (n = 2 per time point). B, Expression in mice infected by E.coli and control group in GDS4583 (n = 3 per group). C, Expression in mice after 24-h infection by S.aureus deficient in alpha-hemolysin (Hla-/-) and wild type S.aureus (WT) with saline treated mice as control group (n = 3 per group). D, Expression in mice after 90-d exposure to 50 ppm arsenate (AS) with untreated mice as control in GDS4914 (n = 5 per group). E, Expression in resistant rat strain (VR) to ventilator-associated lung injury (VALI) and sensitive rat strain (VS) to VALI under treatment of high tidal volume ventilation (HV) with untreated mice as control (C) group in GDS2709 (n = 3 per group). Each bar represents mean±SEM. Statistical difference is indicated by different letters (P<0.05), * (P<0.05) and ** (P<0.01) above the bars.

