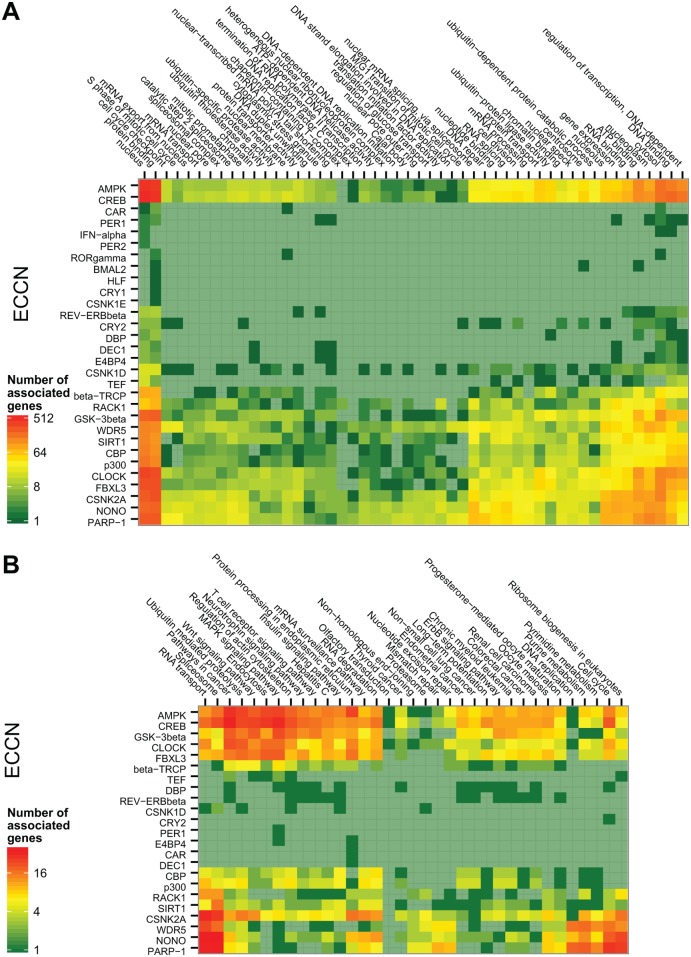
Fig 5. Homogenous functional spectrum of genes targeted by different ECCN genes.
The specific functions of genes interacting with each individual ECCN gene were counted and illustrated as heat map. Annotated KEGG pathways (A) and GO terms (B) found to be overrepresented amongst all predicted target genes in the preceding analysis were counted for each target gene, and these counts were then accumulated for each individual ECCN gene and represented as colours according to the legend. Rows and columns are ordered according to a hierarchical clustering.

