
Fig 7. Network representation of CCN/ECCN network together with the 118 predicted target genes (NCRG).
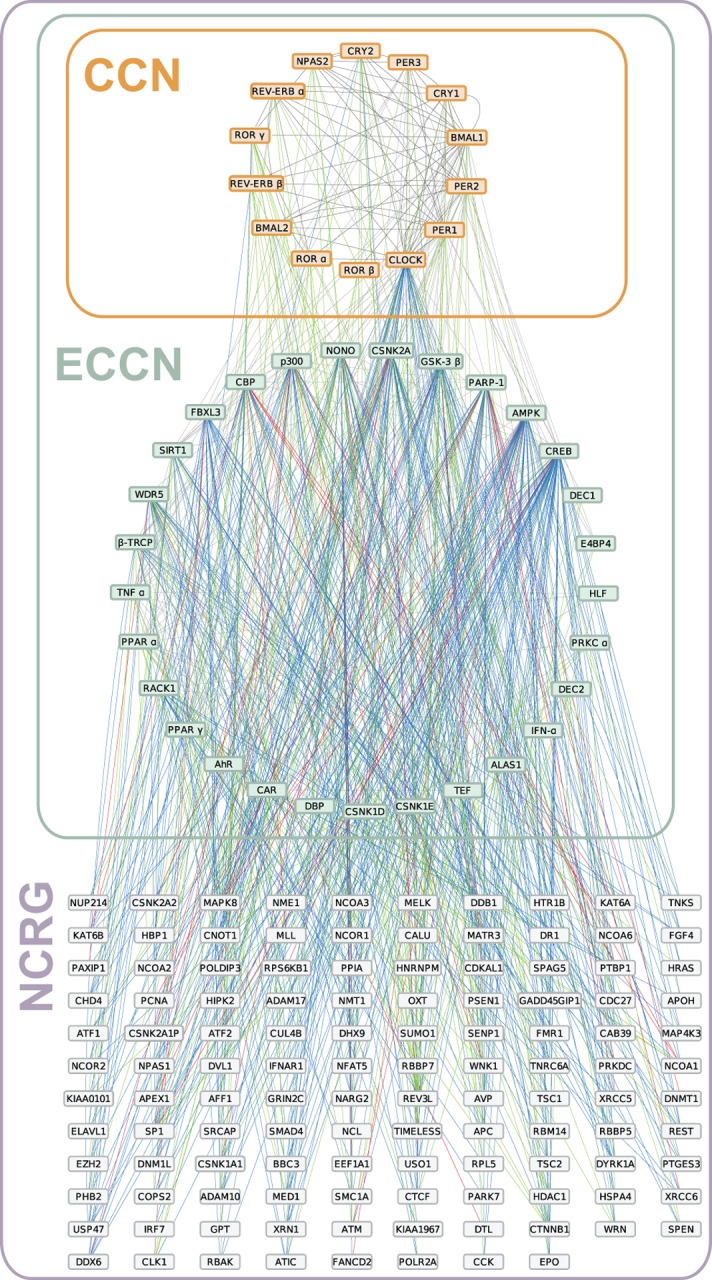
Boxes represent individual genes, which are connected by lines reflecting interactions that are known (grey), predicted by co-expression (blue), text-mining (green), or by both (red). The sub-networks are indicated by rectangles, the CCN (orange), the ECCN (green), and NCRG (purple).