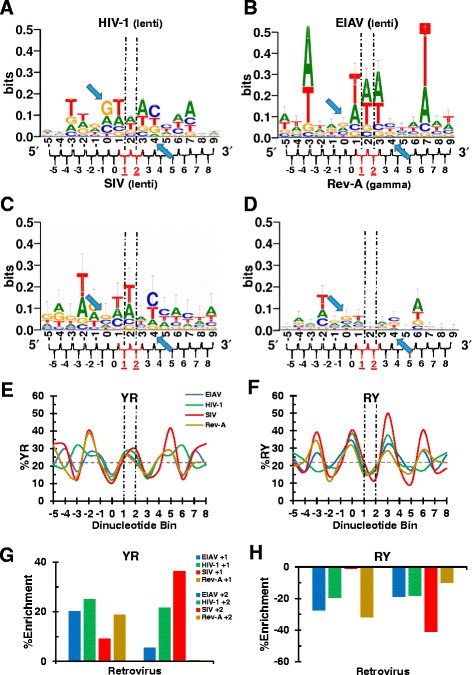
Figure 2.

Sequence logos and dinucleotide step analysis of integration sites from retroviruses that yield 5 bp TSDs. Sequence logos for HIV-1 (A), EIAV (B), SIV (C), and Rev-A (D). (E) YR step analysis for the integration sites depicted in panels A-D. (F) Same as in panel E, except RY dinucleotide frequencies were calculated. Statistical analyses of panel E and F results are depicted in Additional file 2: Figure S2 panels C and D, respectively. Percent YR and RY enrichment for each virus compared to random is shown in (G) and (H), respectively. Other labeling is as in Figure 1.
