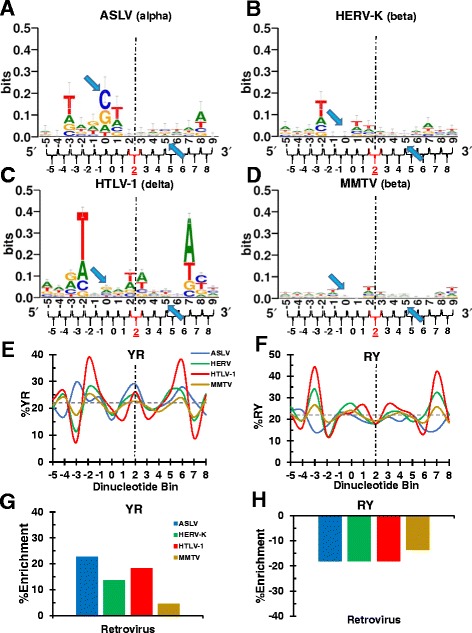
Figure 3.

Sequence logos and YR/RY dinucleotide selectivities of viral integration sites with 6 bp TSDs. Sequence logos are shown for conglomerate integration sites of ASLV (A), HERV-K (B), HTLV-1 (C), and MMTV (D). (E) YR frequency utilization across the integration sites of viruses depicted in panels A-D. (F) Same as in panel E, except the plot is for RY dinucleotide utilization. Statistical analyses of panel E and F results are shown in Additional file 2: Figure S2 panels E and F, respectively. The percent YR and RY enrichment for each virus compared to random is in (G) and (H), respectively. Other labeling is as in Figure 1.
