
Figure 5.
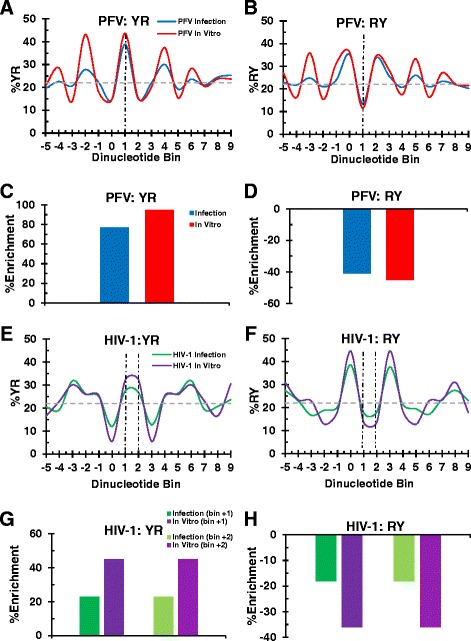
Flexibility profiles for PFV and HIV-1 integration sites in nucleosome-free versus chromatinized tDNA. (A and B) YR and RY frequency charts, respectively, for PFV integration sites into deproteinized genomic DNA (PFV in vitro) and from virus infection. Vertical dotted black line represents central dinucleotide step(s), and horizontal dotted grey line represents the MRC frequency of YR/RY utilization. (C and D)) Bar graphs illustrating the percent YR and RY enrichment, respectively, at the central dinucleotide step relative to MRC values. (E and F) YR and RY frequency charts, respectively, for HIV-1 integration sites into naked plasmid DNA (HIV-1 in vitro) and from virus infection. (G and H) Bar graphs illustrating the percent YR and RY enrichment, respectively, at the central dinucleotide steps compared to MRC.