Figure 7.

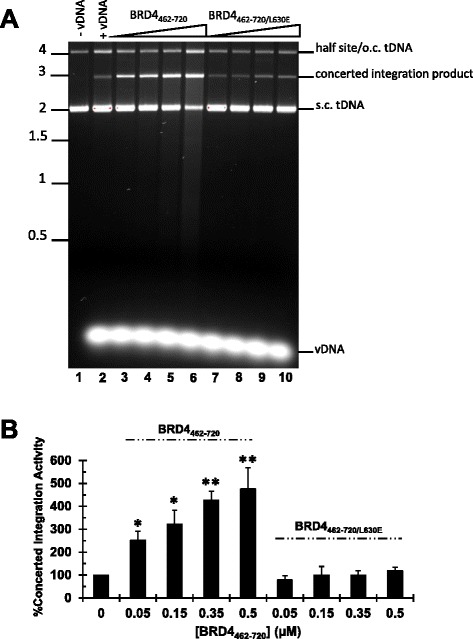
Concerted integration activity of Rev-A IN. (A) Ethidium bromide stained image of Rev-A IN integration reactions in the presence of increasing concentrations of indicated BRD4462–720 protein. Migration positions of standards (in kb) are shown to the left, and the positions of single vDNA end, or half-site, and concerted vDNA integration products, as well as supercoiled (s.c.) and open circular (o.c) forms of the plasmid tDNA, are to the right. Lanes 1 and 2: Rev-A IN and tDNA incubated without vDNA or with vDNA, respectively. Lanes 3–6: increasing concentrations (0.05, 0.15, 0.35, 0.5 μM) of BRD4462–720 incubated with Rev-A IN plus vDNA and tDNA. Lanes 7–10: same as lanes 3–6 but with BRD4462–720/L630E. (B) Strand transfer activities for three independent experiments ± standard error of the mean, measured by quantification of DNA band intensity. The results were normalized to the level of Rev-A IN concerted integration activity in the absence of BRD4462–720 proteins, which was set to 100%. P values of <0.05 and <0.01 are indicated by * and **, respectively, as determined by one-tailed t-test.
