Figure 2.
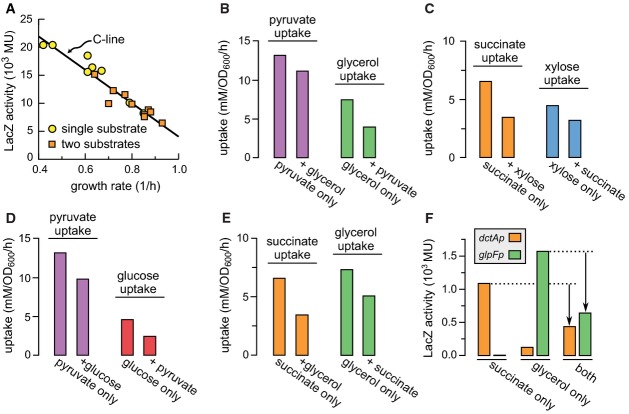
- A LacZ expression level (in activity per OD600 or Miller Unit) of E. coli K-12 cells grown in minimal medium with various carbon substrates and IPTG is plotted against the growth rate of the culture. Yellow circles and orange squares respectively represent results for growth on one (shaded entries in Table1) or two carbon substrates (clear entries in Table1). Both sets of results align along a single line (linear regression: R2 = 0.92, P < 10−7 called the C-line, described by equation 1 with horizontal intercept λC = 1.16 ± 0.05/h (see Fig1A).
- B The uptake rates of pyruvate and glycerol, as measured during growth on pyruvate only, glycerol only, or both. As expected from the negative feedback loop illustrated in Supplementary Fig S1, the uptake of either substrate is reduced in the presence of the other. (Reported are averages over two experiments, which never deviated more than 5% from the mean.)
- C–E As (B), but for succinate + xylose (C), pyruvate + glucose (D), and succinate + glycerol (E). See Supplementary Fig S3 for more examples.
- F Expression of lacZ reporter genes driven by the dctAp and glpFp promoters, which respectively control the uptake systems of succinate and glycerol. In the presence of glycerol, the expression of the succinate uptake system is markedly reduced and vice versa (black arrows).

