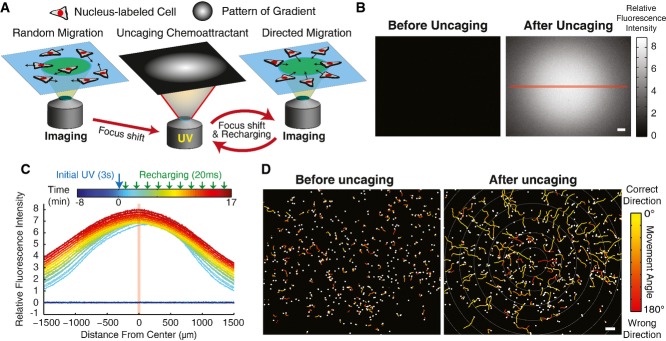
Figure 1.

- Schematic of strategy for time-lapse live-cell imaging combined with automated manipulation of chemoattractant gradients using ultraviolet (UV) uncaging of a caged derivative of a chemoattractant. In between designated time points, a spatial gradient of UV light is produced with an out-of-focus objective to initiate or recharge the gradient. Recharging pulses were small periodic pulses intended to offset the effects of gradient dissipation by diffusion.
- Images of spatial gradients of fluorescein before and after UV uncaging of CMNB-fluorescein. The left image was acquired 8 min and 41 s before the initial uncaging, and the right image was acquired 5 min and 18 s after the initial uncaging. The scale bar indicates a length of 100 μm.
- Time course of the intensity profile of the fluorescein gradient cross-section indicated with the red line in (B).
- Tracks of the movement of PLB-985 cells for 5-min intervals before (ending 37 s before uncaging) and after gradient generation (ending 17 min and 35 s after initial gradient generation) using a caged chemoattractant (Nv-fMLF) and the uncaging strategy described in (A). The tracks are overlaid on top of the images of the last time point in each time interval. Color indicates the direction of movement toward (yellow) or away from (red) the gradient center. The scale bar indicates a length of 100 μm.
