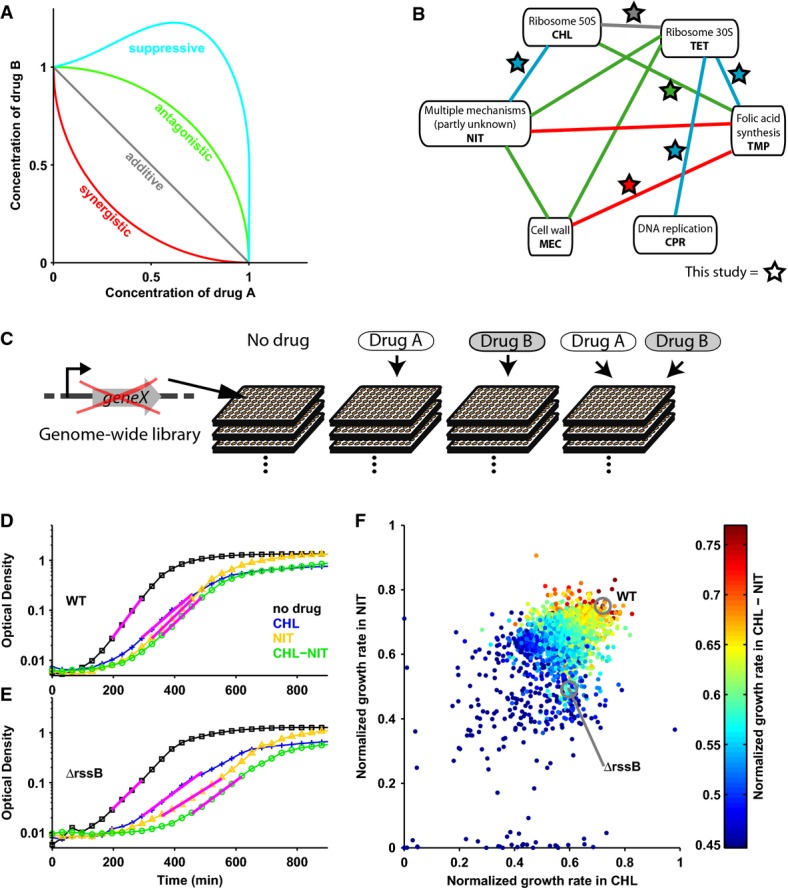
Figure 1.

- Schematic: lines of equal growth (isoboles) in two-dimensional concentration space of drugs A and B; isobole shape determines drug interaction (Loewe, 1928). Synergistic drug pairs have stronger than additive, antagonistic ones weaker than additive effect on growth. In suppressive interactions, the combination effect is weaker than that of one of the drugs alone.
- Interaction network for six antibiotics: synergism is red; antagonism, green; suppression, blue; stars show drug combinations investigated here.
- Schematic illustrating approach, see the text for details.
- Wild-type E. coli (WT) growth curves without drug (black), under chloramphenicol (blue), nitrofurantoin (yellow), and chloramphenicol–nitrofurantoin combination (green); magenta lines are exponential fits (Materials and Methods).
- As (D) for the rssB mutant which has a lower growth rate but unchanged drug interaction.
- Scatterplot: growth rates of ˜4,000 E. coli gene deletion mutants under chloramphenicol and nitrofurantoin alone and under the combination (color scale).
