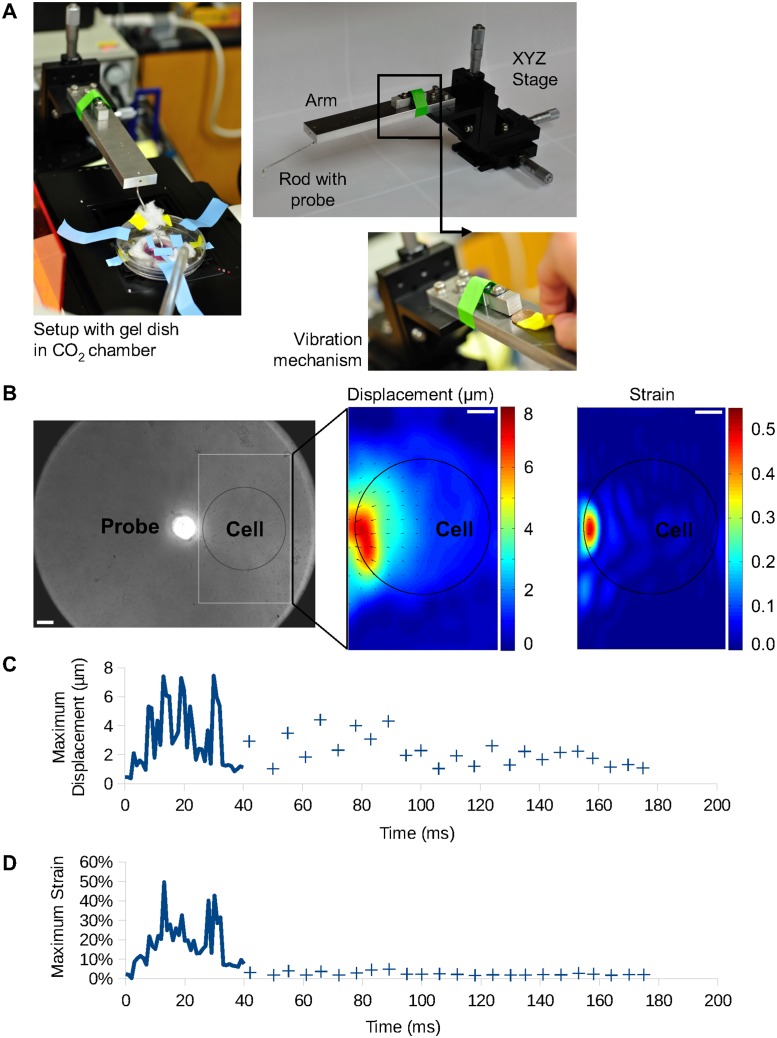
Fig 2. Mechanical stimulation equipment and vibration characterization.
(A) Pictures of the vibration stimulation equipment with different components: XYZ stage, with micrometers attached, aluminum arm and aluminum rod with probe (top right panel); vibration mechanism and spacer ready to trigger the vibration (bottom right panel); setup with the aluminum rod already inserted in the aperture of the CO2 chamber and with probe positioned on the gel (left panel). (B) The left image shows the probe and gel substrate with 1 μm beads embedded. The right images show a typical displacement (in μm) and strain maps, with the cold and hot color representing the small and large displacement/strain, respectively. In both colormaps, the vectors are the displacements on the substrate. The black circle represents the typical position of a cell (~125 μm of diameter) during stimulation. The bars represent 25 μm. (C) Maximum displacement of the gel over time. (D) Maximum strain of the gel over time. For both graphs, the data points are plotted with 1 ms interval for the first 40 ms of vibration and, until 180 ms, for the frame with largest probe displacement in each vibration period.

