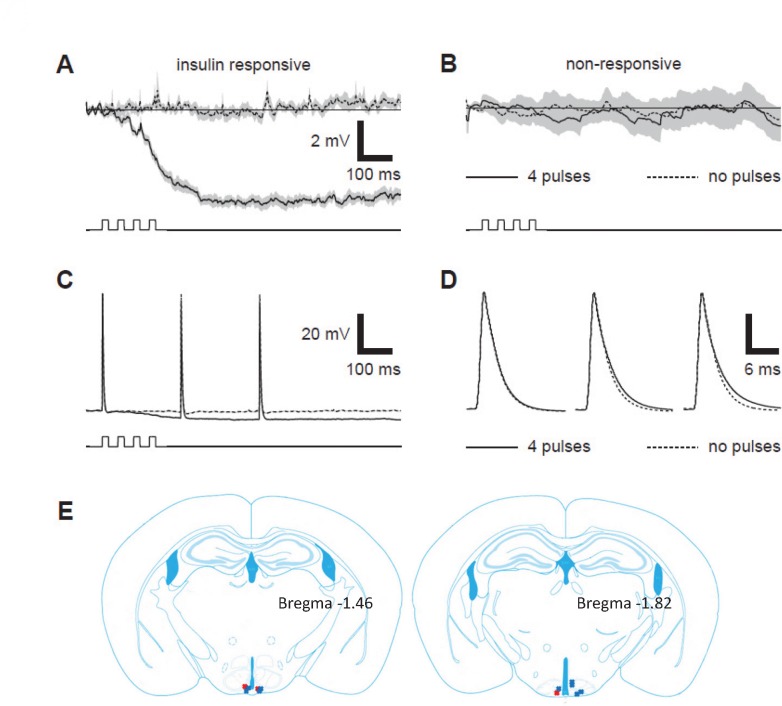
Fig 1. Electrophysiological response of Kiss1 neurons to insulin.
A: Averaged membrane potential (Vm) recordings from an insulin-responsive Kiss1 neuron elicited with (solid line) and without (dashed line) a 4 x 20 ms pressure application of 200 nM insulin in ACSF. Gray shading represents the mean ± SEM from traces averaged across 11 repetitions obtained every 10 sec. B: same as A with recordings averaged across 11 repetitions from a Kiss1 neuron that did not respond to pressure pulses of 200 nM insulin. Time course of pressure pulses is shown below Vm traces in A—B. C: recordings from same neuron in A in which APs were elicited by 0.2 ms depolarizing current pulses during (solid line) and without (dashed line) 4 x 20 ms pressure application of 200 nM insulin in ACSF. D: APs from C displayed on magnified time scale and aligned at peak to identify whether any changes occurred in AP time course. E: Locations of recordings from EGFP positive Kiss1 neurons. Red Xs represent insulin-responsive neurons, and the blue Xs represent insulin nonresponsive neurons. Modified from Mouse Brain in Stereotaxic Coordinates, 3 rd Edition by Franklin and Paxinos (used with permission).

