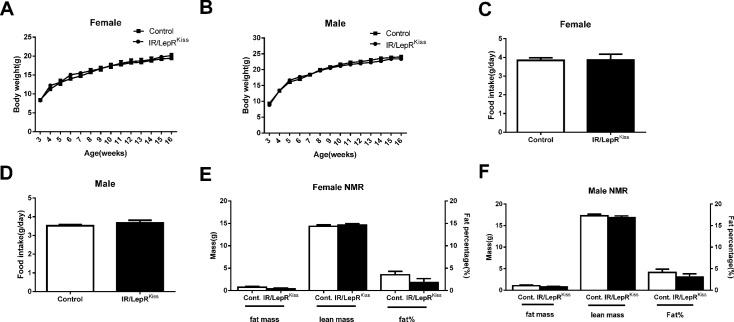
Fig 9. Metabolic phenotype in IR/LepRKiss mice.
(A) Weekly body weight of female mice (Control n = 15 and IR/LepRKiss n = 8) mice (B) Weekly body weight of male mice (n = 16 each group). (C) Female average daily food intake calculated from weekly measurement. (D) Male average daily food intake calculated from weekly measurement. (E) Female body composition at the age of 4 months in control (n = 13) and IR/LepRKiss (n = 7) mice. (F) Male body composition at the age of 4 months in control (n = 15) and IR/LepRKiss (n = 12) mice.

