
Figure 4.
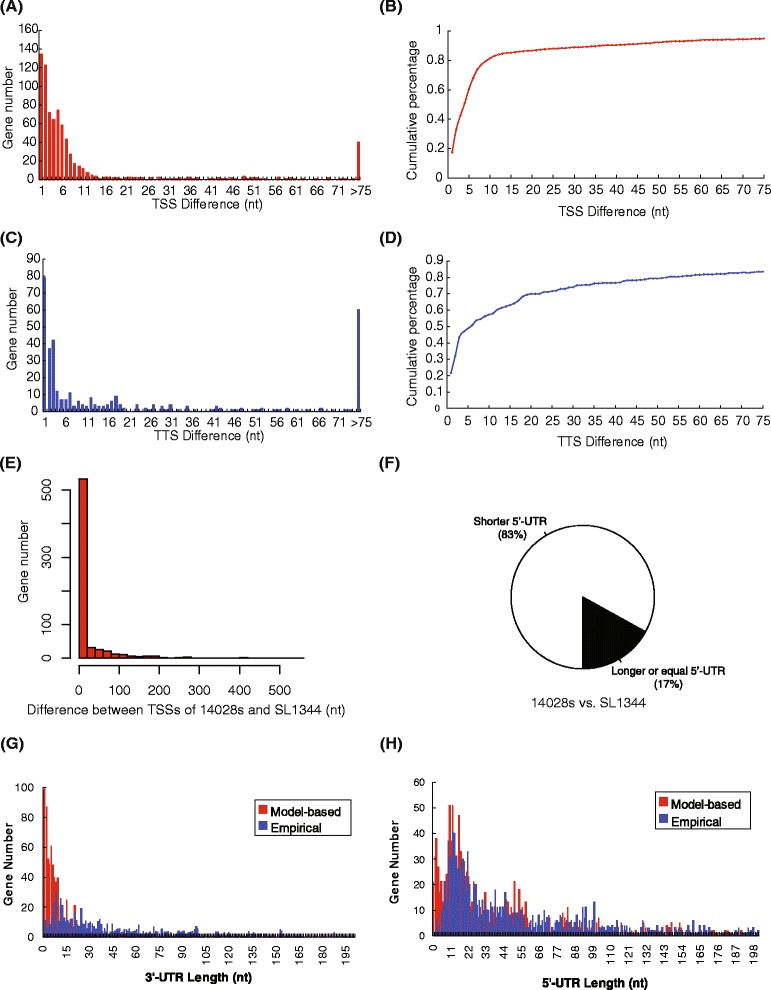
Accuracy of TSSs and TTSs detected from S. Typhimurium 14028s directional RNA-seq data. Our empirical method was combined with statistical tests to yield (A) the actual and (B) cumulative distribution of position differences between TSSs detected for individual genes. This data is matched with Figure 3C. The actual (C) and cumulative (D) distribution of position differences between TTSs detected for individual genes. (E) The consistency of detected TSSs between S. Typhimurium 14028s and SL1344 strains. (F) Comparison of 5′-UTR length of 14028s genes and SL1344 genes based on the TSSs detected in this study and from Kröger data [14], respectively. ‘Shorter’ or ‘longer’ meant that the 5′-UTRs were shorter or longer in 14028s than in SL1344, respectively. Any nucleotide position influences caused by inter-strain genetic differences were excluded from this analysis. Comparison of 3′-UTR length (G) and 5′-UTR length (H) between the Poisson distribution model-based method and our empirical method.