
Figure 5.
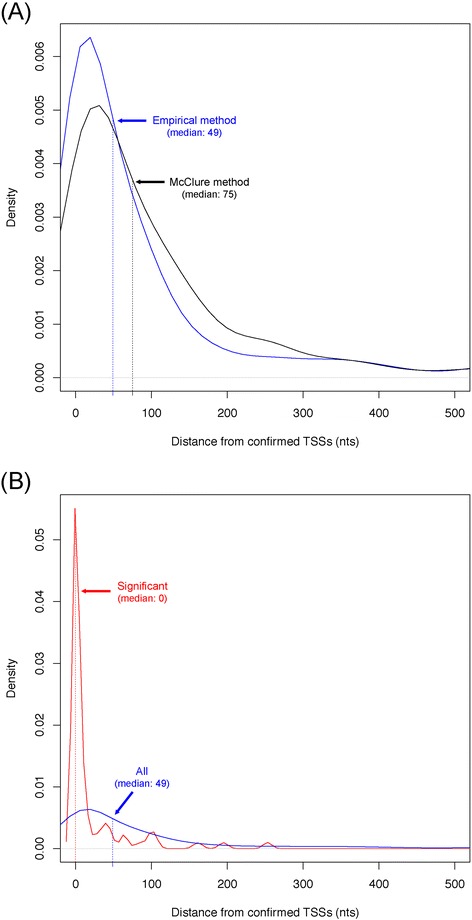
Performance comparison of tools on TSS prediction from E. coli GAII RNA-seq data. (A) Distance distribution between validated TSSs and those predicted with the empirical method (blue) and the distribution-based McClure method [7] (black). (B) The distance distribution between 70 TSSs predicted with the empirical method that had also been experimentally validated. The blue and red curves represent total and statistically significant TSSs respectively. In both (A) and (B), the distance between predicted and validated TSSs and corresponding distribution density were shown on horizontal axis and vertical axis, respectively. The median distances were indicated beside each corresponding distribution curve.