
Figure 7.
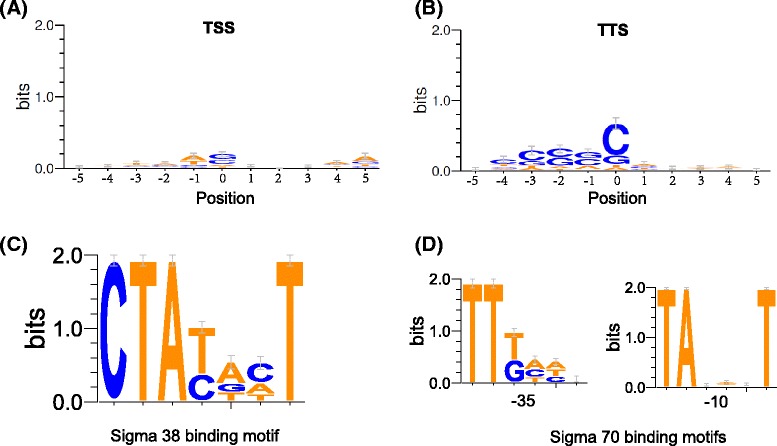
Position-specific nucleotide composition features of transcription border regions or promoters. Nucleotide composition at TSSs (A) or TTSs (B) predicted using the empirical method. The position ‘0’ represents the TSS or TTS, minus values represent upstream positions and positive values represent downstream positions. Nucleotide composition of the −10 region of putative sigma 38 binding sites (C) or the −35 and −10 regions of putative sigma 70 binding sites (D) identified in the S. Typhimurium 14028s chromosome.