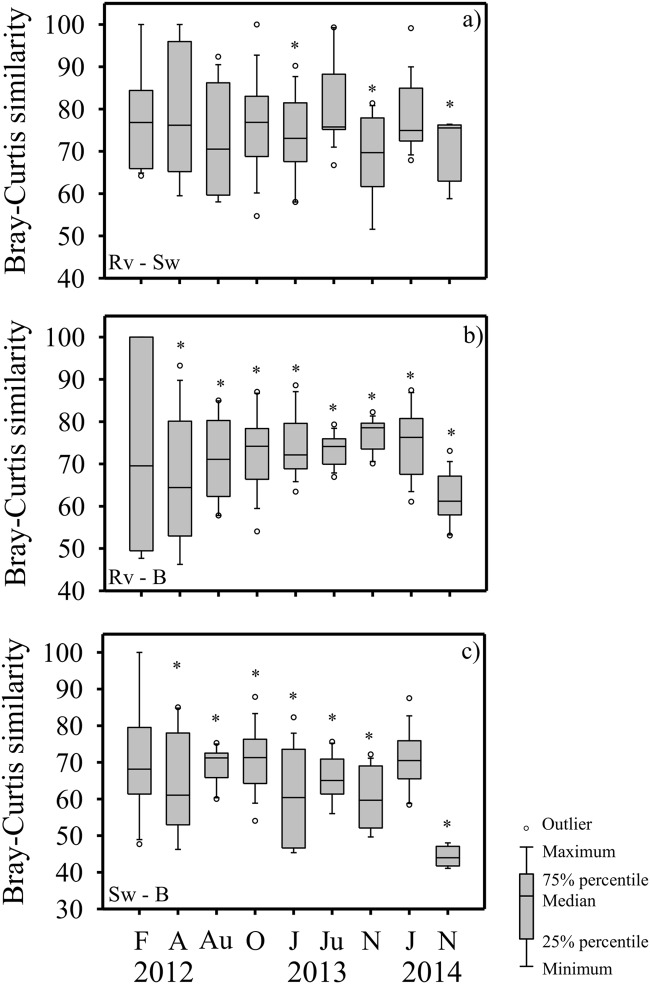
Fig 9. Similarity in the dune plant assemblages among the beach sites over time.
Similarity of plant assemblages (note scale: 40–100%) between a) Revetment—Sewall, b) Revetment—Beach, c) Sewall—Beach were calculated from the Bray-Curtis similarity matrix (ANOSIM, S2 Table). Sampling times as in Fig 3. *significant differences (p < 0.05) in the similarity of plant assemblages between sites (Rv vs Sw, Rv vs B, and Sw vs B) at each time.

