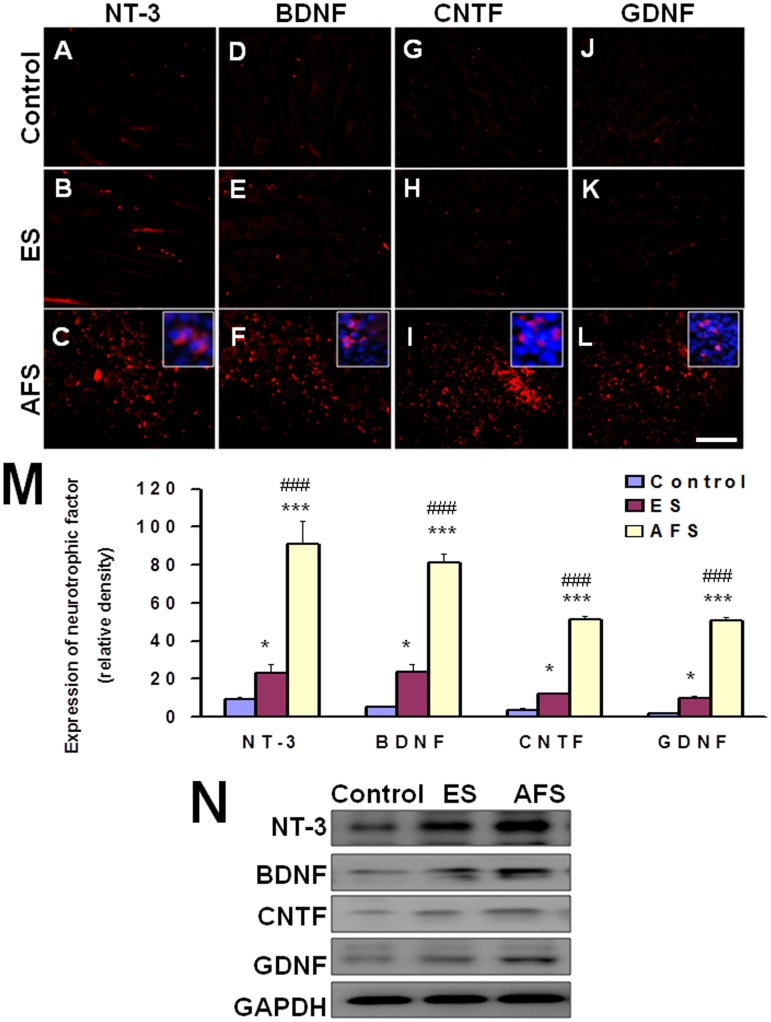
Fig 3. Representative of expression of neurotrophic factor in the denervated muscle 2 weeks after denervation.
(A, B, C) expression of NT-3 in control, ES, and AFS group (D, E, F) expression of BDNF in control, ES, and AFS group (G, H, I) expression of CNTF in control, ES, and AFS group (J, K, L) expression of GDNF in control, ES, and AFS group (M) quantitative analysis of neurotrophic factors in different treatment group. (N) The representative of western blot analysis in different treatment related to expression of various neurotrophic factors. Bar length = 100 μm, N = 6, Control, ES, and AFS: see text. Blue color in C, F, I, and L showed the magnification of Hoechst 33342 merged with various neurotrophic factors of NT-3, BDNF, CNTF, and GDNF. Bar length = 100 μm, N = 6 for each group, * p<0.05 and *** p<0.001indicated a significant difference as compared to the control group; ### p<0.001 indicated a significant difference as compared to the ES group.

