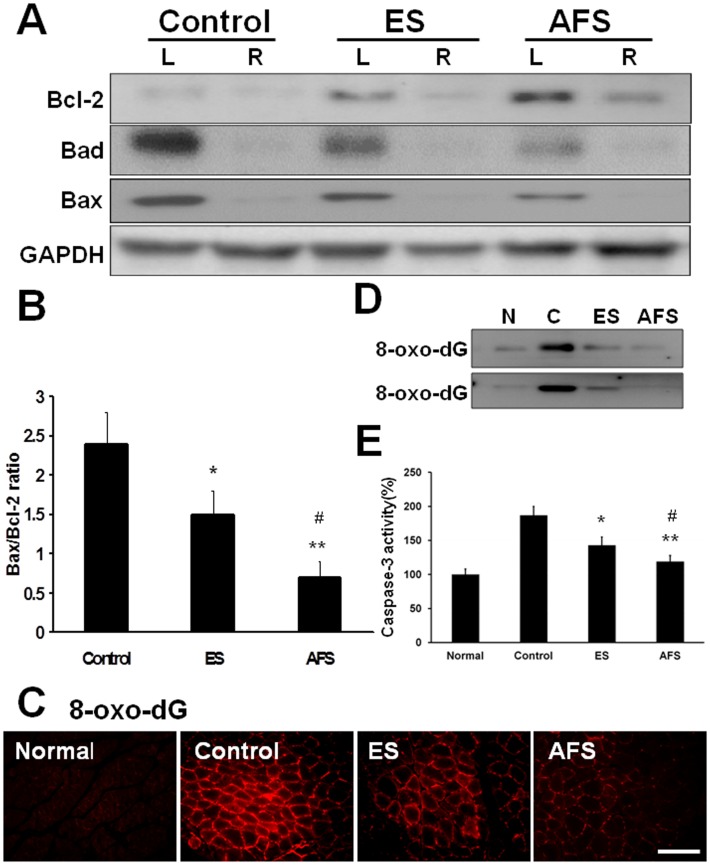
Fig 5. Expression of apoptotic factors in denervated muscle 2 weeks after denervation.
(A) Expression of Bcl-2, Bad, and Bax in denervated muscle subjected to different treatment (B) Quantitative analysis of apoptotic markers in different treatment groups (C) The expression of 8-oxo-dG in normal, control, ES, and AFS group. (D) The representative of western blot analysis of 8-oxo-dG related to different treatment (n = 2) (F) Quantitative analysis of caspase-3 in different treatment groups Bar length = 100 μm. R = right, L = left, N = 6 for each group, * p<0.05 and **p<0.01indicated a statistical difference compared to the control group; # p<0.05 indicated a statistical difference as compared to the ES group.

