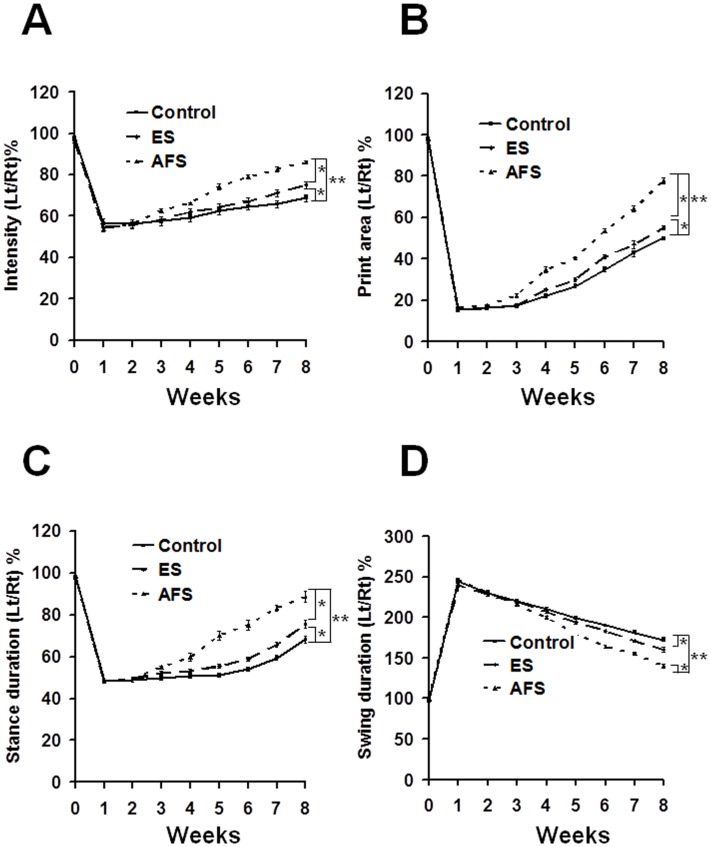
Fig 6. Illustration of various parameters of the CatWalk XT system subjected to various treatments and at different time frames.
(A) Illustration of the intensity in different treatment groups (B) Illustration of the print area in different treatment groups (C) Illustration of the stance duration in different treatment groups (D) Illustration of the swing duration in different treatment groups. *p<0.05; **p<0.01 N = 6 for each group.

