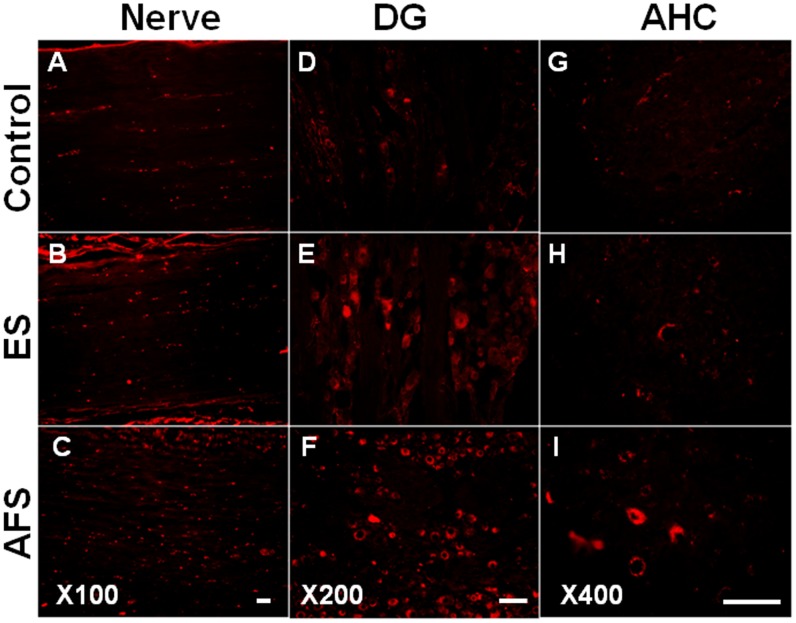
Fig 7. Representative of CTB tracer (Cholera toxin B) distributed to nerve, dorsal root ganglion and anterior horn cells.
(A, B, C) Illustration of CTB tracer over the proximal end of nerve in different treatment groups (magnification X 100) (D, E, F) Illustration of CTB tracer over dorsal root ganglion in different treatment groups (magnification X 200) (G, H, I) Illustration of CTB tracer over the anterior horn cells in different treatment groups (magnification X 400). Bar length = 100 μm, n = 6 for each group.

