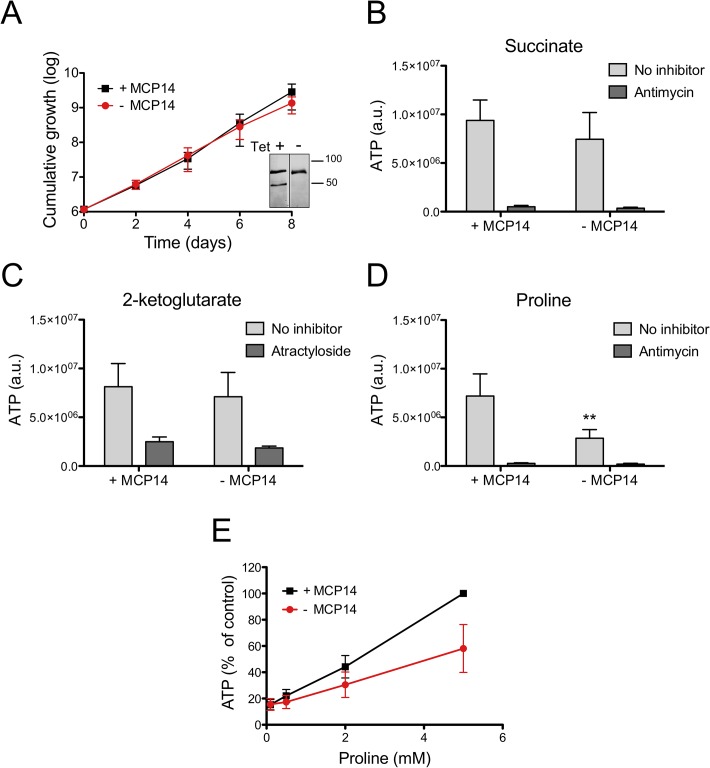
Fig 10. ATP production by crude mitochondria from TbMCP14 conditional knock-out procyclic forms.
A) Growth curves of parasites cultured in SDM80 containing 10% normal FBS in the presence (black squares, +MCP14) or absence (circles,-MCP14) of tetracycline. Data points represent mean values ± standard deviations from three independent experiments. After 6 days of culture, parasites were permeabilized with 0.01% digitonin and crude mitochondria were isolated. The inset shows SDS-PAGE/immunoblots probed with anti-cMyc antibody to detect TbMCP14 (lower band) and anti-HSP70 antibody to demonstrate equal loading. The samples were run on the same blot and exposed for equal times (for depletion of TbMCP14 see also Fig 7D and S5 Fig). B,C,D) ATP production in isolated mitochondria was measured by addition of 67 μM ADP and 5 mM succinate (B), 2-ketoglutarate (C) or proline (D). Antimycin (2.7 μM, panels B, D) or atractyloside (43 μM, panel C) were added to inhibit complex III of the electron transport chain or ADP/ATP translocation, respectively. The bars are mean values ± SD from five independent experiments. The asterisks represent statistical difference relative to the respective controls (**p<0.01, unpaired student’s t test). E) Concentration-dependent ATP production by crude mitochondria from MCP14-expressing (black squares, +MCP14) or-depleted (red circles,-MCP14) parasites using proline as substrate. The data points have been normalized to the ATP production of control cells at the highest proline concentration (5 mM). The numbers represent mean values ± SD from four independent experiments.

