
Fig 5. PCoA clustering analysis of baseline and 12-week samples in the placebo group.
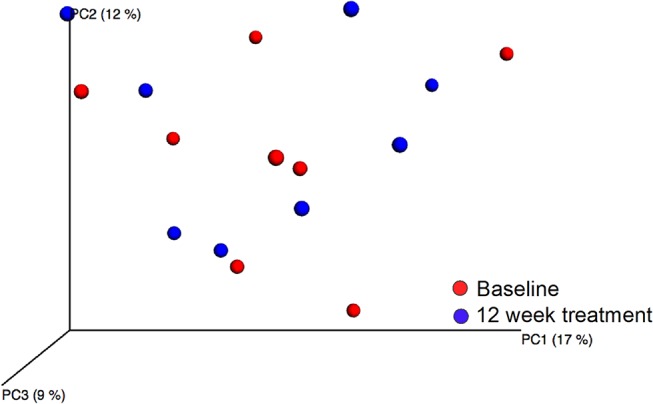
Red dots indicate baseline samples and blue dots 12 week samples.
Official websites use .gov
A
.gov website belongs to an official
government organization in the United States.
Secure .gov websites use HTTPS
A lock (
) or https:// means you've safely
connected to the .gov website. Share sensitive
information only on official, secure websites.
Red dots indicate baseline samples and blue dots 12 week samples.