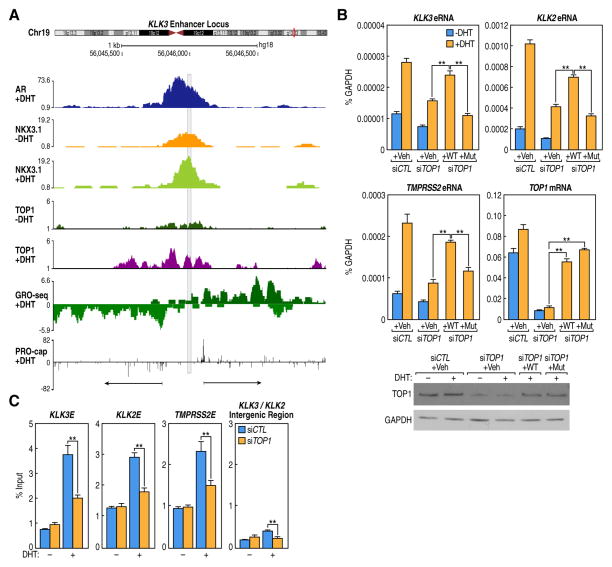
Figure 3. TOP1 Recruits toAR -Regulated Enhancers and Nicks the DNA.
(A) UCSC browser screenshot displaying the KLK3 enhancer. Arrows indicate the PRO-caps representing (putative) eRNA TSS flank the NKX3.1 peak. (B) eRNA readout assay showing that Tyr723 of TOP1 is required for eRNA induction. LNCaP cells were hormone-starved for 24 h, transfected with siTOP1 to deplete the endogenous protein and then electroporated with either empty expression vector (Veh), wild-type TOP1 (WT), or the Y723F-TOP1 mutant (Mut) before treatment with either ethanol or DHT for 1h. eRNA for KLK2, KLK3 and TMPRSS2 gene enhancers was quantified by RT-PCR. TOP1 mRNA and protein levels are also shown. qPCR data show mean ± s.d.; (n=3). **P<0.01. (C) Knockdown of endogenous TOP1 affects nick/break formation as measured by incorporation of Biotin 11-dUTP at selected AR-enhancers after 10 min DHT treatment. Data represent mean ± s.d.; (n=3). **P<0.01.

