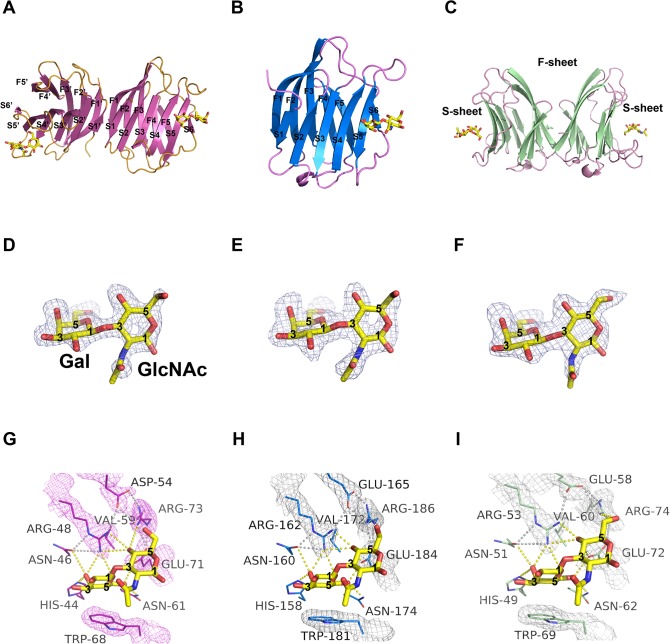
Fig 1. Structural overview of hGal1, 3-CRD and 7 in complex with LN1.
(A-C) Ribbon representations of three LN1-hGal complexes where LN1 (shown in yellow stick model) is bound to hGal1 (A), hGal3-CRD (B) and hGal7 (C). Numbering of the β-strands of S-sheet (S1-S6) and F-sheet (F1-F5) is also shown as indicated. (D-F) F o -F c omit electron density map of LN1 (contoured at 2.5σ) bound to hGal1 (D), hGal3-CRD (E) and hGal7 (F). To make it clear, carbons 1, 3 and 5 of Gal and GlcNAc are labeled. (G-I) β-galactoside-recognition site of hGal1-LN1 (G), hGal3-CRD-LN1 (H) and hGal7-LN1 (I) complexes. Residues involved in LN1 recognition are highlighted with 2F o -F c electron density (contoured at 1σ). Polar interactions among galectin residues and within galectin/LN1 complex are shown as gray and yellow dash lines, respectively.

