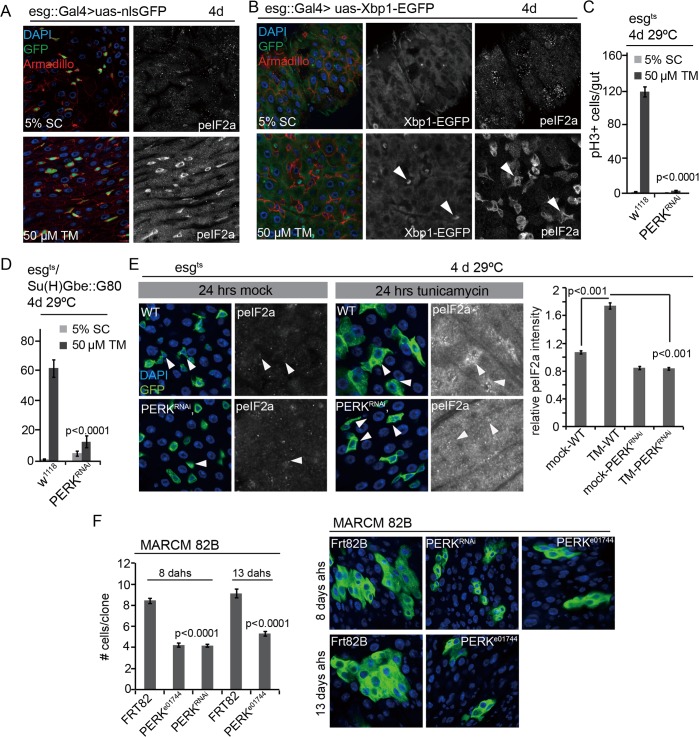
Fig 2. PERK integrates local and tissue-wide ER stress responses to regulate ISC proliferation.
(A) Phosphorylation of eIF2α is induced in ISCs/EBs when young intestines are exposed to excessive ER stress. Guts of esg::Gal4, UAS::nlsGFP (nuclear-localized GFP) were immunostained with anti-peIF2α and anti-Armadillo antibodies in either the mock condition (5% sucrose) or after treatment with 50 μM Tunicamycin. (DNA: DAPI blue; GFP: green. Armadillo:red). peIF2α channel is shown separately on the right. (B) Xbp1 is spliced in ISCs/EBs when young intestines are exposed to excessive ER stress. GFP (GFP only expressed in Xbp1 splicing) and peIF2α channels are shown separately on the right. (C,D) Knockdown of PERK in ISCs/EBs (esgts, C) or specifically in ISCs (esgts/Su(H)Gbe::G80, D) prevents tunicamycin-induced ISC proliferation. Intestines of PERKRNAi co-expressed with Dicer2 or wild-type (Dicer2 only) were examined. Averages and SEM are shown. P values from Student’s T test, N>10. (E) Phosphorylation of eIF2α in ISCs/EBs is not induced under ER stress in ISCs in which PERK is knocked down (esgts). Intestines were exposed to either mock conditions (5% sucrose) or to 50 μM tunicamycin (TM). DAPI, blue; GFP, green, peIF2α shown as separate channel in white. Arrowheads for orientation. Quantification of phospho-eIF2α staining in ISCs relative to neighboring ECs in wild-type guts and in guts expressing PERKRNAi in ISCs/EBs (esgts) shown on the right. Averages and SEM are shown. P values from Student’s Test. (F) Quantification of MARCM clone sizes at 8 days and 13 days after heat shock for PERK loss-of-function (PERKe01744, PERKRNAi) conditions. Averages and SEM are shown. P values from Student’s T test. Number of clones examined: n = 455 (8 d FRT82B); n = 213 (8 d PERKe01744); n = 389 (8 d PERKRNAi); n = 200 (13 d FRT82B); n = 198 (13 d PERKe01744). Representative images for PERK loss-of-function (PERKe01744, PERKRNAi) at 8 days and 13 days after heat shock are shown on the right. (DAPI, blue; GFP, green). See also S2 and S4 Figs.

