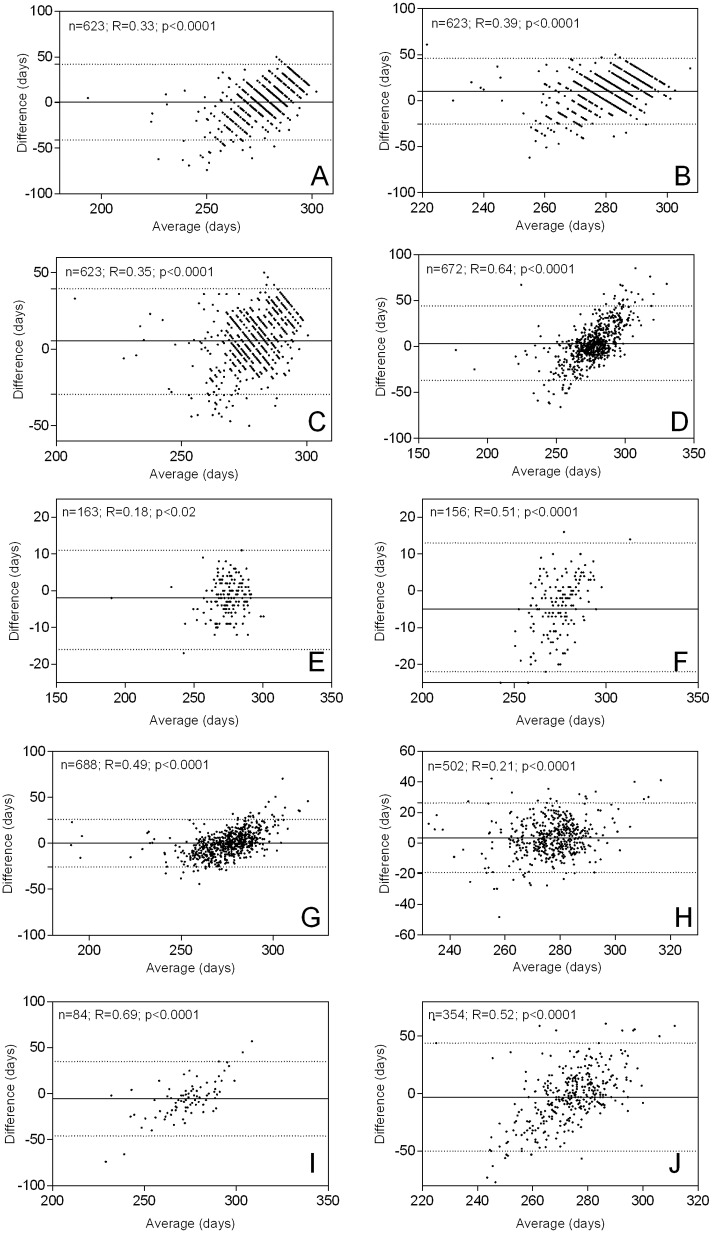
Fig 3. Bland-Altman Plots and Levels of Agreement.
A) BS (external); B) BS (neuromuscular); C) BS (total); D) LMP; E) mid-pregnancy ultrasound; F) late-pregnancy ultrasound; G) linear SFH model; H) sequential SFH model; I) Quickening; J) corrected LMP*. The continuous horizontal lines are average levels of agreement. The dashed lines denote the 95% levels of agreement between the clinical estimators and the reference method. R represents the Pearson correlation coefficient and p values indicate significance of the parametric correlations. Significant trends are present in all comparisons, indicating significant variability in the bias across the data range. The correlations are all positive, meaning that the clinical estimators tend to further underestimate lower estimates of GA, which is demonstrated by the high number of PTB predicted by most clinical methods (Table 4).

