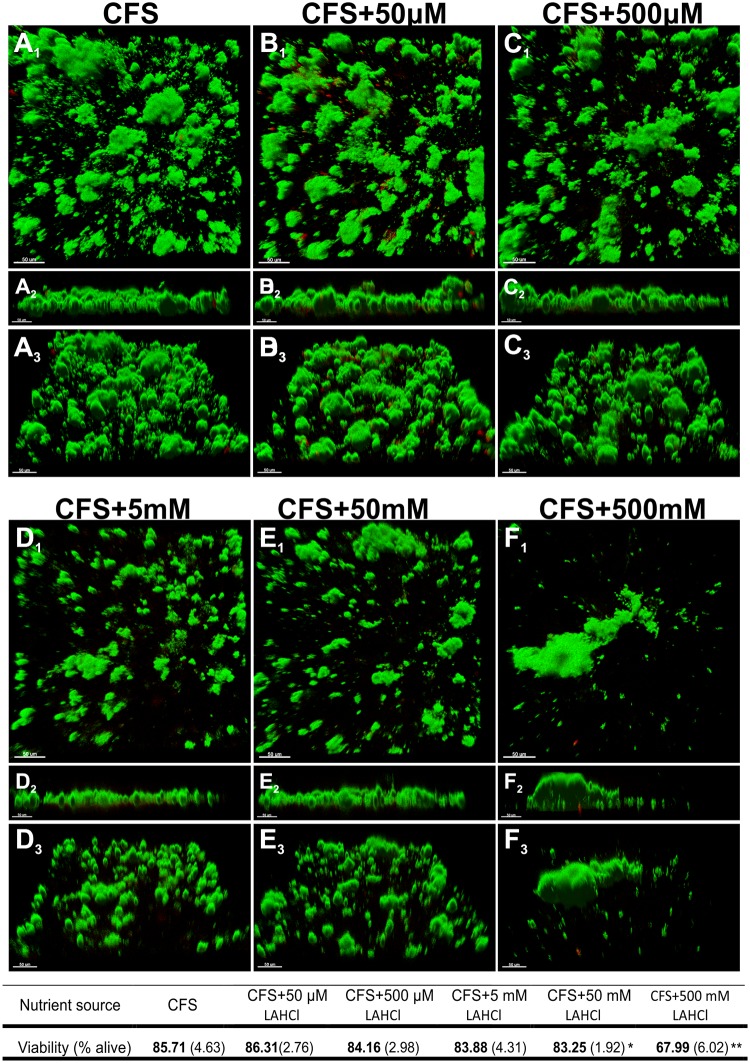
Fig 1. Differences in architecture of oral biofilms grown a static biofilm system containing different concentrations of L-arginine monohydrochloride (LAHCl).
Images show representative 3D renderings of 22 h-old oral biofilms grown from a cell-containing saliva (CCS) inoculum in the static biofilm system containing cell free saliva (CFS) supplemented with different concentrations of LAHCl. Green signal (Syto 9) indicates viable cells and red signal (propidium iodide) indicates damaged/dead cells. Upper renderings (A1–F1) are of the x–y plane. Middle renderings (A2–F2) are of the x–z plane. Lower renderings (A3–F3) represent an angled view (x–y–z). Bars represent 50 μm. The associated table shows changes in percentage of cell viability with means presented in bold and standard deviations shown in parentheses (each derived from at least 27 images from nine biological replicates). *P<0.05; **P<0.01: significant differences from the CFS control.

