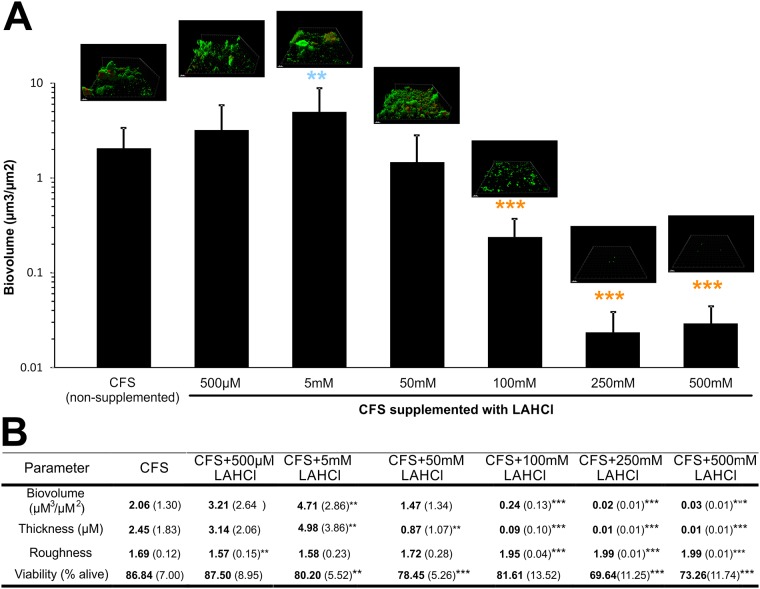
Fig 2. Effects of flowing saliva supplemented with different LAHCl concentrations on the development of oral biofilms for 20 h in the Bioflux system.
The graph shows differences in biofilm biovolume and representative CLSM 3D renderings are included to highlight differences in biofilm architecture. Light blue colored star symbols embedded in the graph indicate a significant increase in average biofilm biovolume over CFS control and orange colored star symbols embedded in the graph indicate a significant decrease in average biofilm biovolume over CFS control. For the rendered biofilms within the embedded images, green colored cells indicate viable cells and red colored cells indicate damaged/dead cells. Bars represent 20 μm. The associated table shows, in addition to the biovolumes highlighted in the graph, changes in average biofilm thickness, average biofilm roughness, and cell viability. For data presented in the associated table, means are shown in bold and standard deviations are shown in parentheses (each derived from at least 18 images from six biological replicates). *P<0.05; **P<0.01; ***P<0.001: significant differences from the CFS control.

