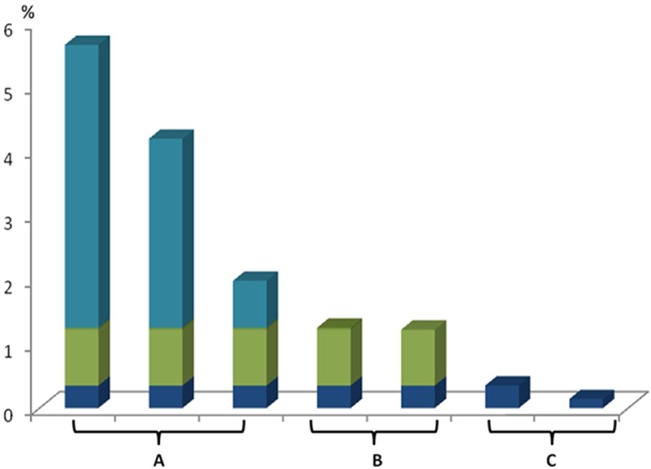
Fig 1. The ratios of MPMTs in different systems.

0.99% refers to the prevalence of MPMTs in 15,398 patients with malignant tumors. Group A included patients with head and neck cancer (5.65% versus 0.99%; P = 0.000), urinary tumors (4.19% versus 0.99%; P = 0.000) and gynecological tumors (1.98% versus 0.99%; P = 0.008). Group B included patients with breast cancer (1.22% versus 0.99%; P = 0.241) and digestive system tumors (1.25% versus 0.99%; P = 0.151). Group C included patients with lung cancer (0.35% versus 0.99%; P = 0.000) and leukemia/lymphoma (0.14% versus 0.99%; P = 0.000).
