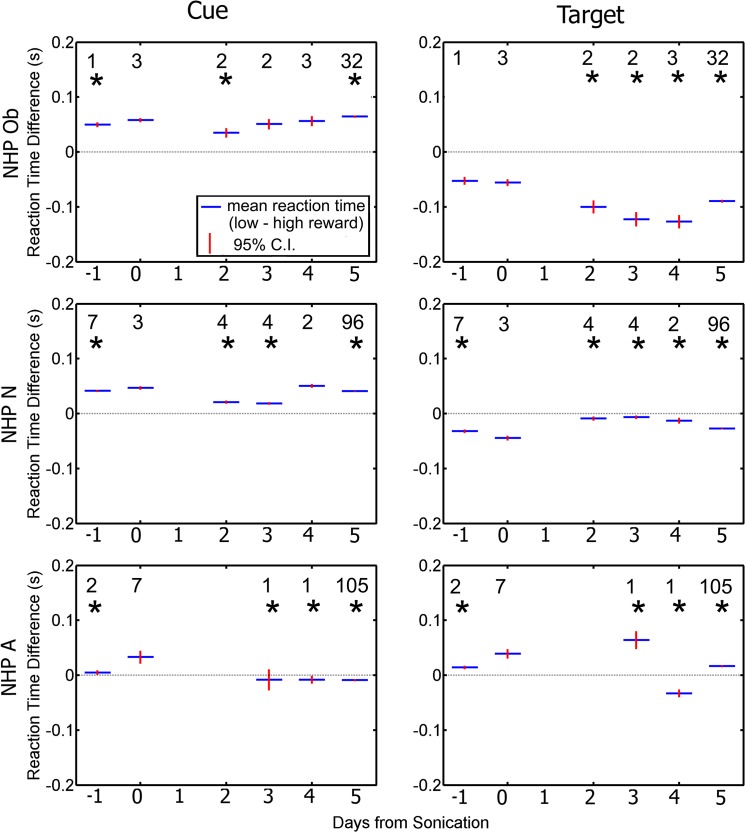
Fig 10. Difference in average reaction time between low and high reward as a function of day relative to the day of the FUS.
Responses to the cue are plotted in the left column. Responses to the target are plotted in the right column. Blue indicates group average (average low reward reaction time—average high reward reaction time) while red is the standard error of the mean. The numbers indicate the n value for that group. Asterisks above each average indicate a significant difference between the difference in reaction time on day 0 compared to the rest of the days (p < 0.05).

