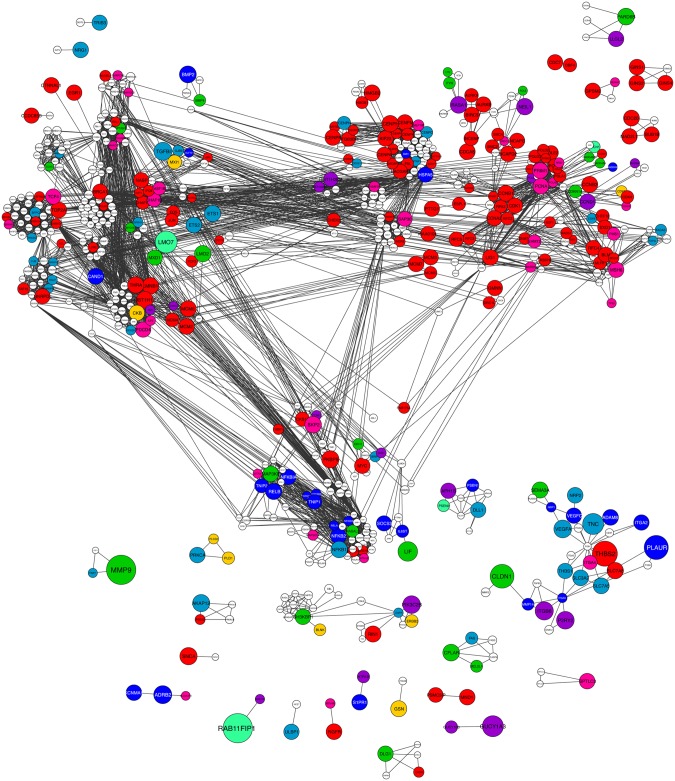
Fig 4. Network representation of human protein complexes with di-chromatic expression profiles.
Protein interaction network representation of human protein complexes containing at least one super-dynamic subunit. Dynamic genes were re-clustered based on best agreement with one of the eight super-dynamic clusters. The nodes are colored according to cluster membership (see Fig 5) and node sizes are indicative of fold absolute changes over time. The network is represented using Cytoscape.

