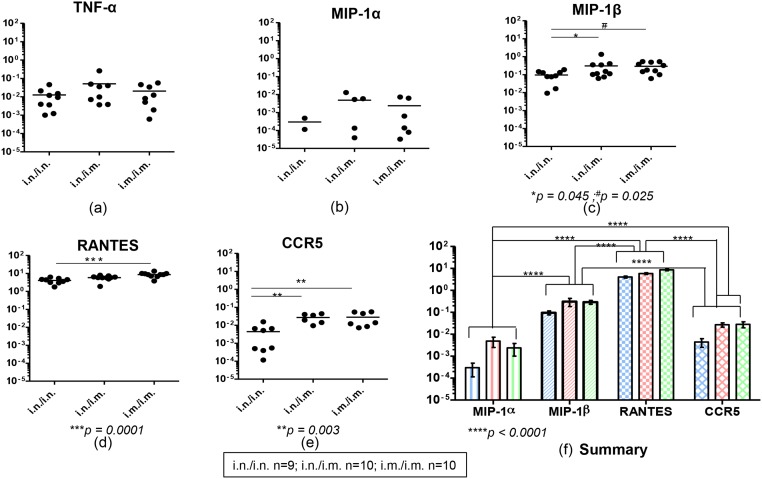
Fig 1. Evaluation of TNF-α, chemokines and chemokine receptor mRNA expression in gut KdGag197–205–specific CD8+ T cells following i.n./i.n., i.n./i.m. and i.m./i.m. vaccination.
BALB/c mice (n = 4–5 per group) were primed i.n. or i.m. with FPV-HIV and boosted i.n. or i.m. with VV-HIV, fourteen days post boost immunization Peyer’s patches were pooled from all animals and cells were then stained with KdGag197–205 tetramer. These gut KdGag197–205—specific CD8+ T cells were sorted in hundred cell pools (i.n./i.n. n = 9, i.n./i.m. n = 10 and i.m./i.m. n = 10 hundred cell pools) in a 96-wells plate, cDNA was synthesized and mRNA expression profiles were evaluated using Fluidigm 48.48 dynamic arrays as described in methods. The log mRNA expression normalised to housekeeping gene L32 (2-ΔCT, where ΔCT = CTgene—CTL32) of TNF-α (a), MIP-1α (b), MIP-1β (c), RANTES (d), CCR5 (e) is shown. All chemokines tested and CCR5 expression in gut KdGag197–205-specific CD8+ T cells following i.n./i.n. (blue), i.n./i.m. (red) and i.m./i.m.(green) vaccination is summarized (f). In each plot (a-e), black circles indicate a pool of hundred gut KdGag197–205-specific CD8+ T cells and black line indicate mean expression. The experiment was repeated three times. Data represent the three experiments.

