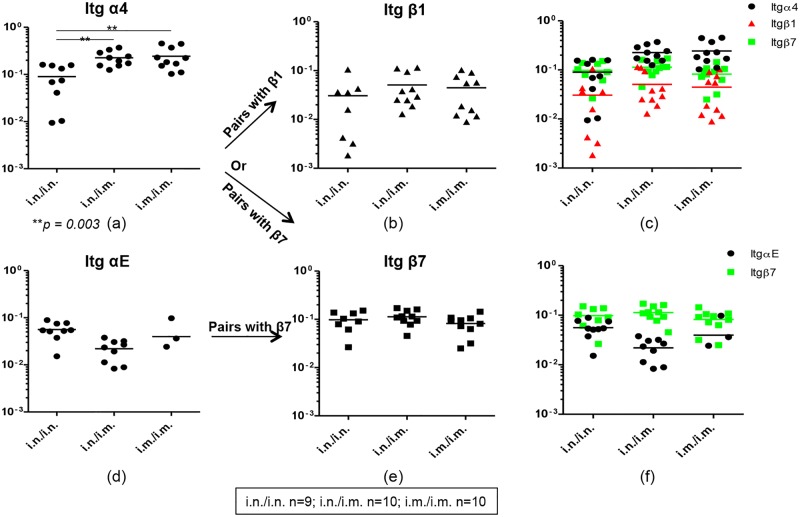
Fig 3. Evaluation of integrins α4, αE, β1 and β7 mRNA expression in gut KdGag197–205-specific CD8+ T cells following i.n./i.n., i.n./i.m. and i.m./i.m. vaccination.
Integrins mRNA expression profile in i.n./i.n., i.n./i.m. and i.m./i.m. immunized pools of hundred gut KdGag197–205-specific CD8+ T cells (i.n./i.n. n = 9, i.n./i.m. n = 10 and i.m./i.m. n = 10 pools) were evaluated using Fluidigm 48.48 dynamic arrays as described in methods. The log mRNA expression normalised to housekeeping gene L32 of integrin α4 (a), β1 (b), α4 (black circle) which can pair up with β1 (red triangle) and β7 (green square) (c), αE (d), β7 (e) and αE (black circle) which can pair up with β7 (green square) (f) is shown. The p values were calculated using one-way ANOVA. In all the plots circles or triangles or square indicate a pool of hundred gut KdGag197–205-specific CD8+ T cells and line indicate mean expression. The experiment was repeated three times. Data represent the three experiments.

