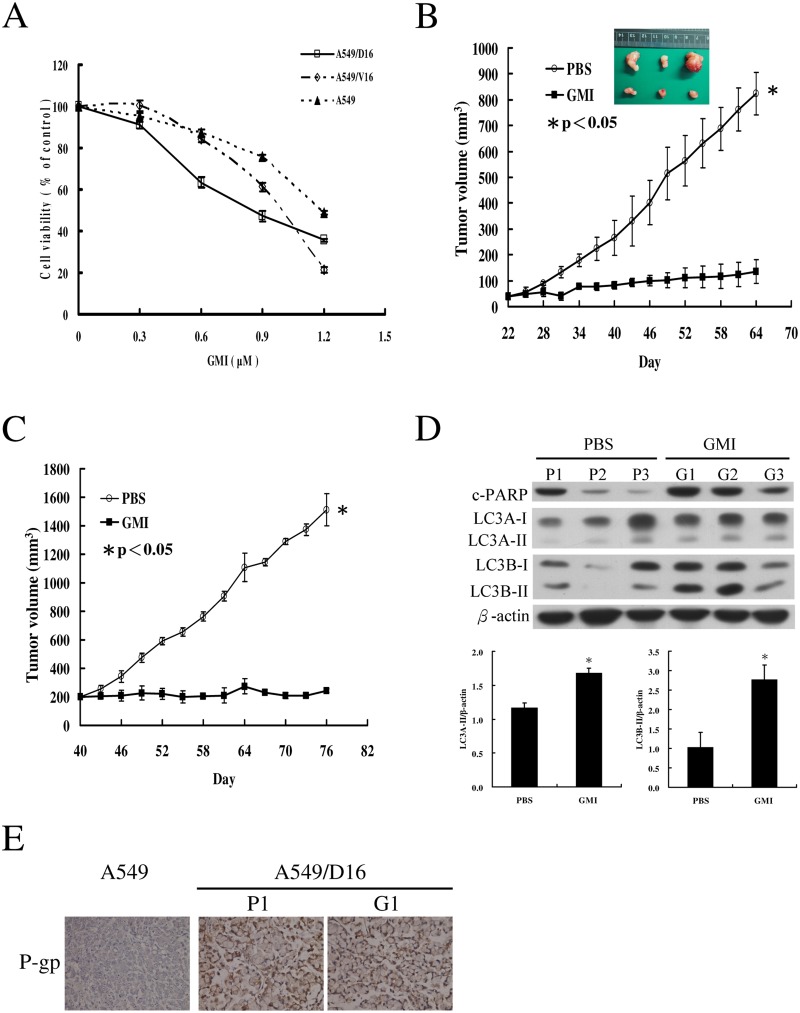
Fig 2. Inhibition of tumor growth by GMI in mice xenograft model.
(A) Analysis of the effects of GMI (0.3, 0.6, 0.9 and 1.2 μM) on cell viability in A549, A549/D16 and A549/V16 cells on MTT assay. (B) Seven days after A549/D16 cell implantation, mice in the PBS group were treated with PBS or GMI by gavage once daily. The tumor sizes of PBS group and GMI group were measured after mice were sacrificed on day 64. (C) Mice were injected subcutaneously for A549/D16 cell implantation. When the tumor volume reached 200 mm3 on day 40, mice in the PBS group were treated with PBS or GMI by gavage once daily. The results are presented as mean ± SD. a non-parametric Mann-Whitney U test was applied with p<0.05 was considered statistically significant. (E) The levels of c-PARP, LC3A and LC3B in six xenograft tumors were determined by Western blotting with statistical analysis of LC3A-II and LC3B-II expressions. (D) Representative immunostaining results of P-gp in lung tumors of A549, A549/D16 treated with PBS (P1) and A549/D16 treated with GMI (G1) were obtained by IHC.

