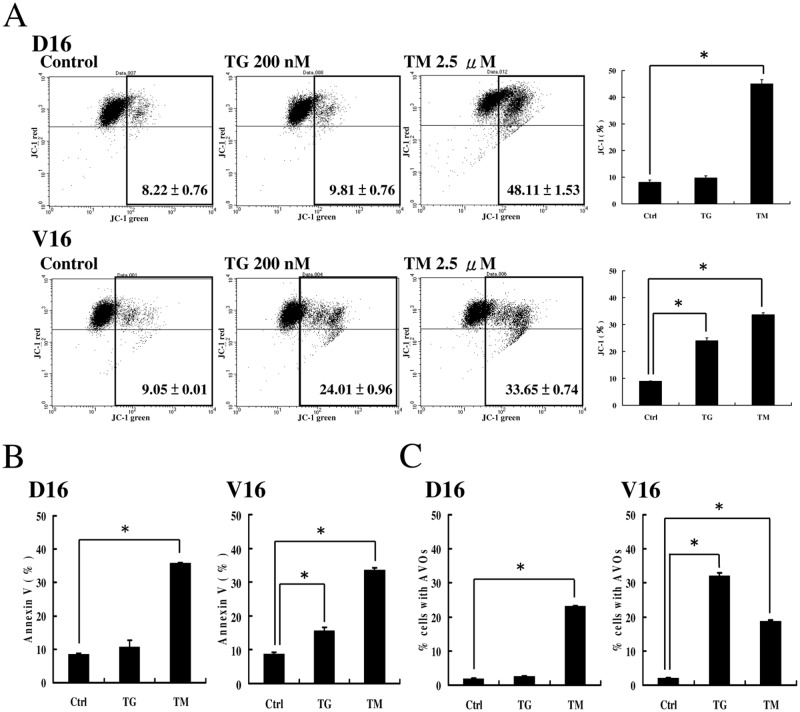
Fig 5. Analysis of apoptosis and autophagy by Annexin V and AVO formation in MDR sublines treated with TG and TM.
(A) JC-1 assay for detection of the mitochondrial membrane potential at 24 h of TG or TM treatment in both sublines. (B) Annexin V was used to label apoptosis in untreated (Ctrl), TG- (200 nM) and TM (2.5 μM)-treated A549/D16 and A549/V16 cells for 48 h. (C) Acridine orange was used to stain AVOs in untreated (Ctrl), TG- (200 nM) and TM (2.5 μM)-treated A549/D16 and A549/V16 cells for 48 h. The cells were visualized using flow cytometry.

