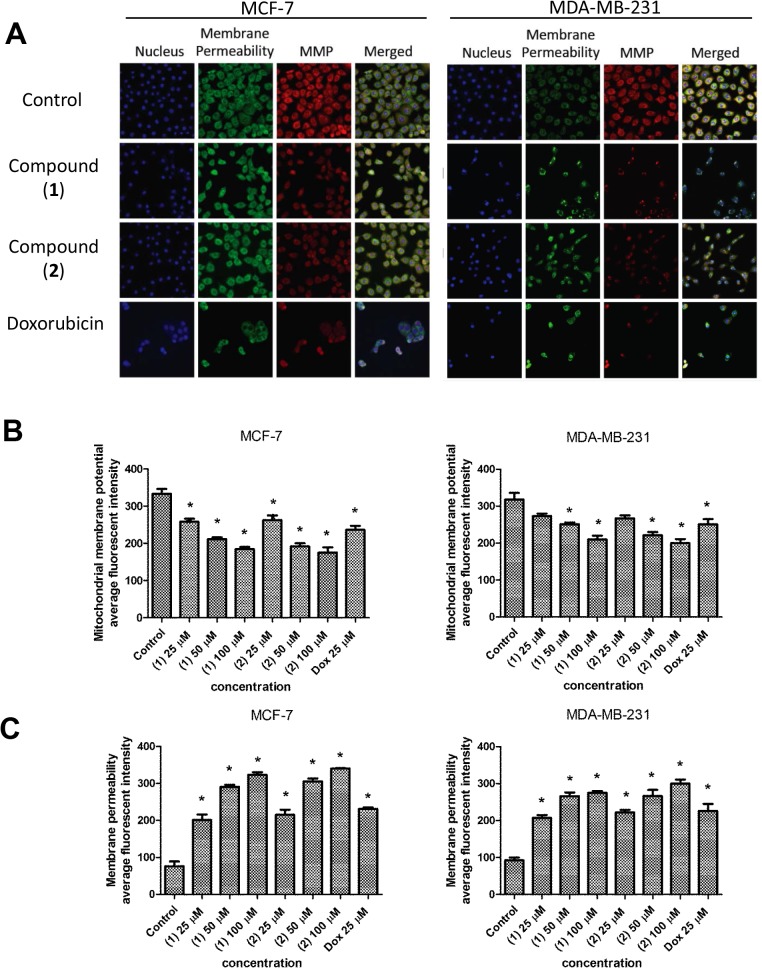
Fig 5. Effect of (1) and (2) on nuclear morphology, membrane permeabilization and MMP in MCF-7 and MDA-MB-231 cells.
(A) Representative figures showing changes in DNA content (blue), cell permeability (green) and MMP (red) distribution patterns in control and treated cells. Doxorubixin (Dox) was used as a positive control. (B) Histogram showing the mean ± SD value of intensities cell permeability and MMP measured by a HCS system. *P<0.05, in comparison to control.

